The Social Analytics tool allows you to see your internal analytic metrics for your Facebook, LinkedIn, and Instagram channels.
Overview
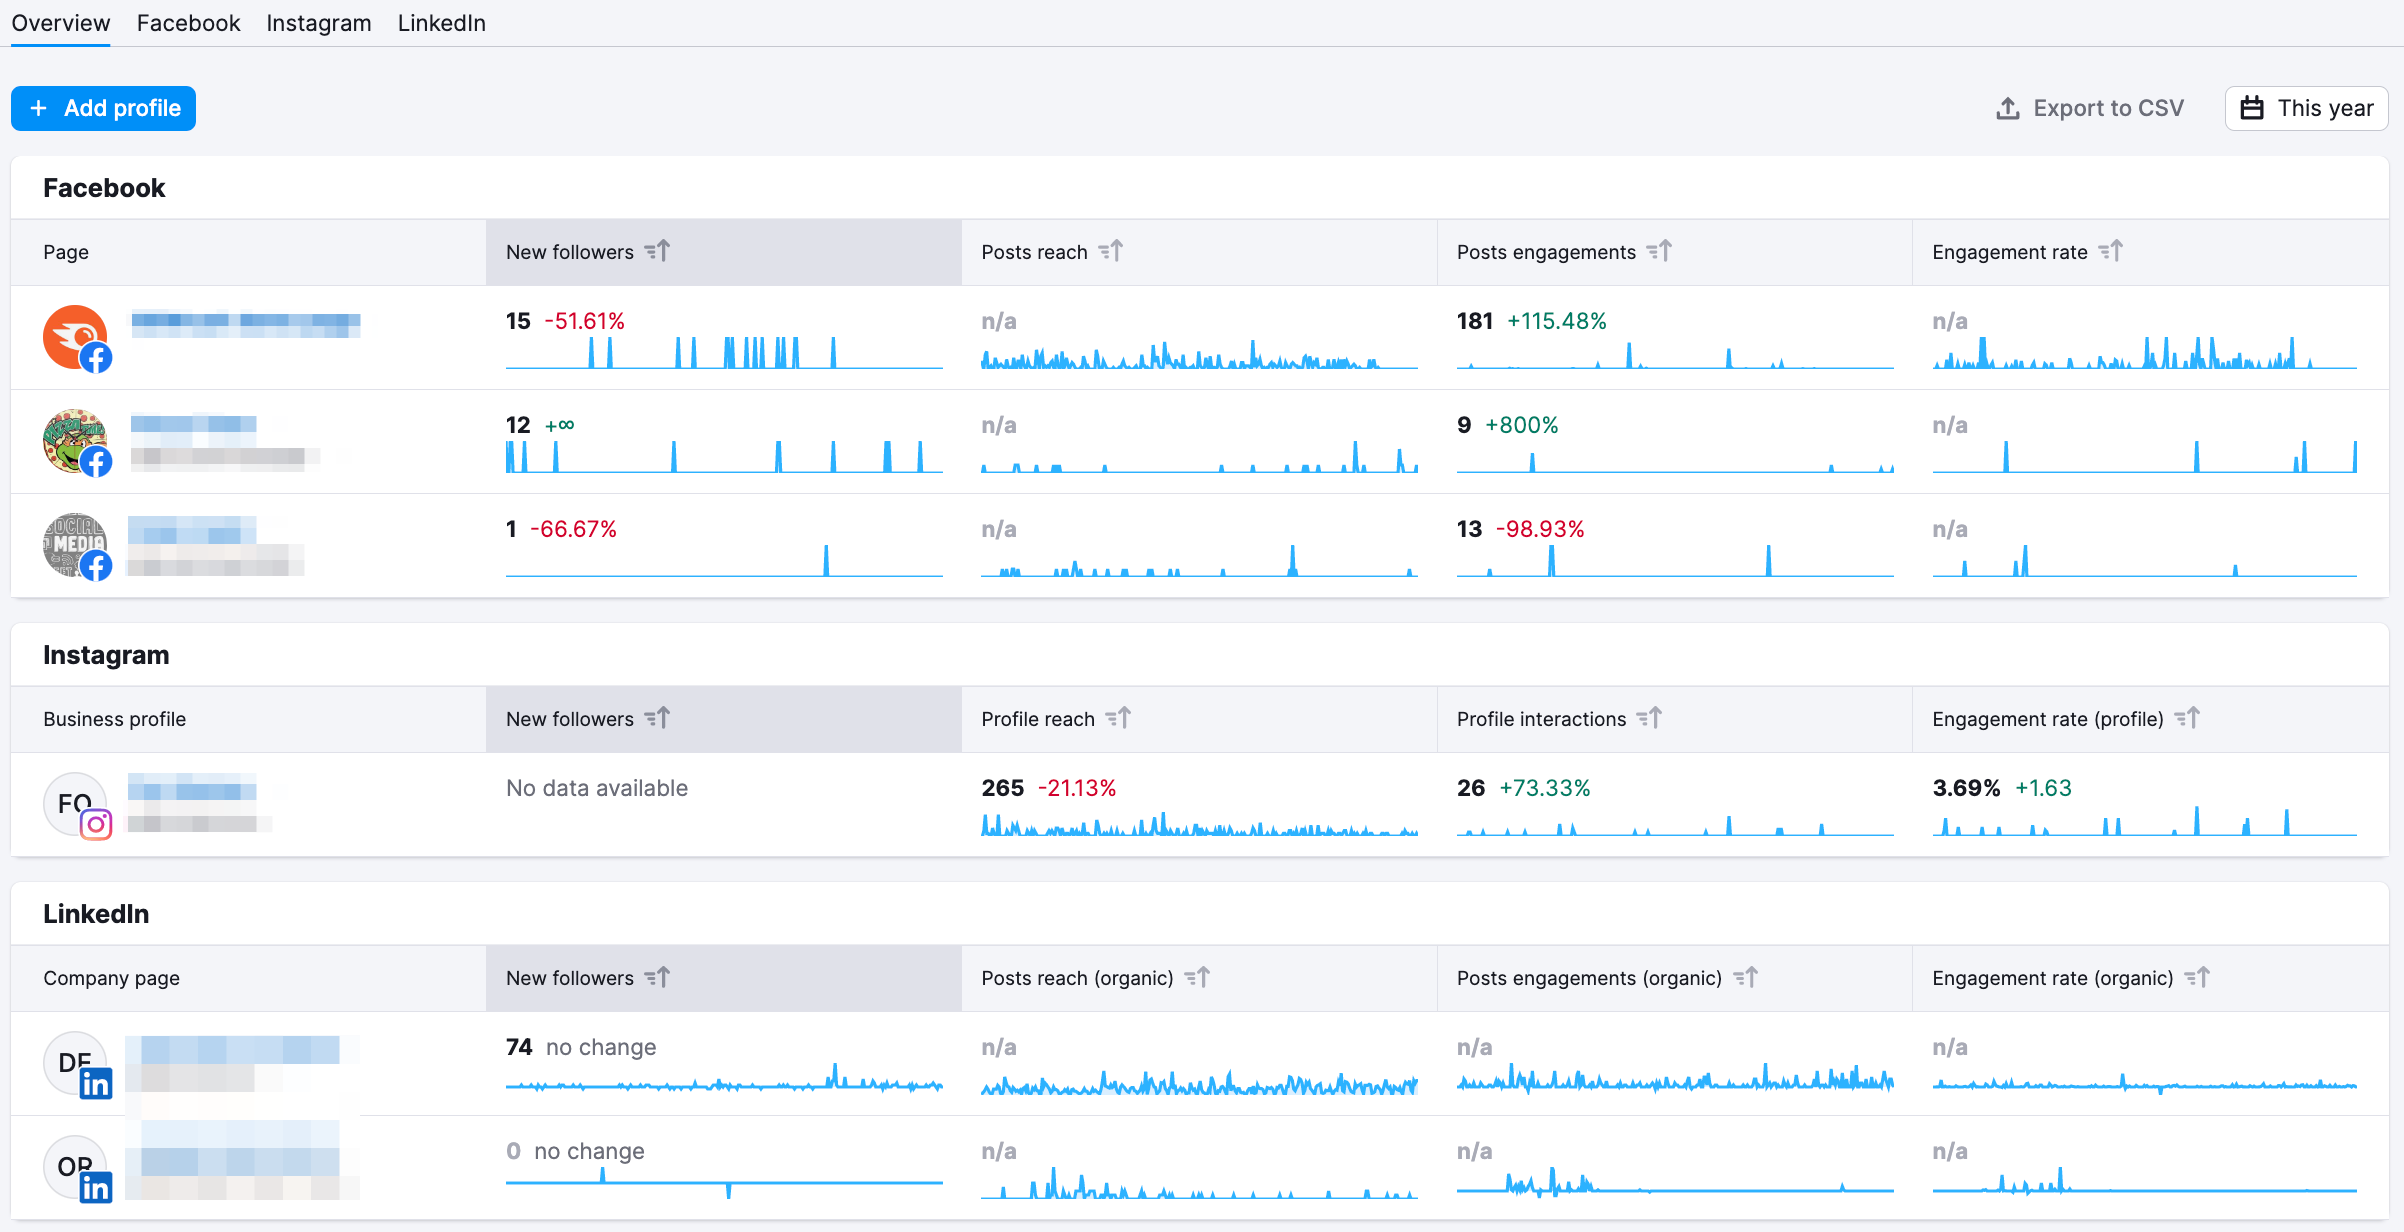
The Overview section of this report will let you see your data from Facebook, Instagram, and LinkedIn Profiles in one view.
With each of these channels, you can see the amount of new followers, the post reach, post engagements, and the engagement rate. Below each of these data sets, you can see the percentage gained or lost over the given time frame. A positive change will be shown in green, while a negative change will be red.
Facebook is currently broken down into four sections: Audience, Page likes, Engagement, and Posts. You are able to get insights about your social media performance by analyzing each of these sections.
You can choose a set date range for Page Likes, Engagement, and Posts reports.
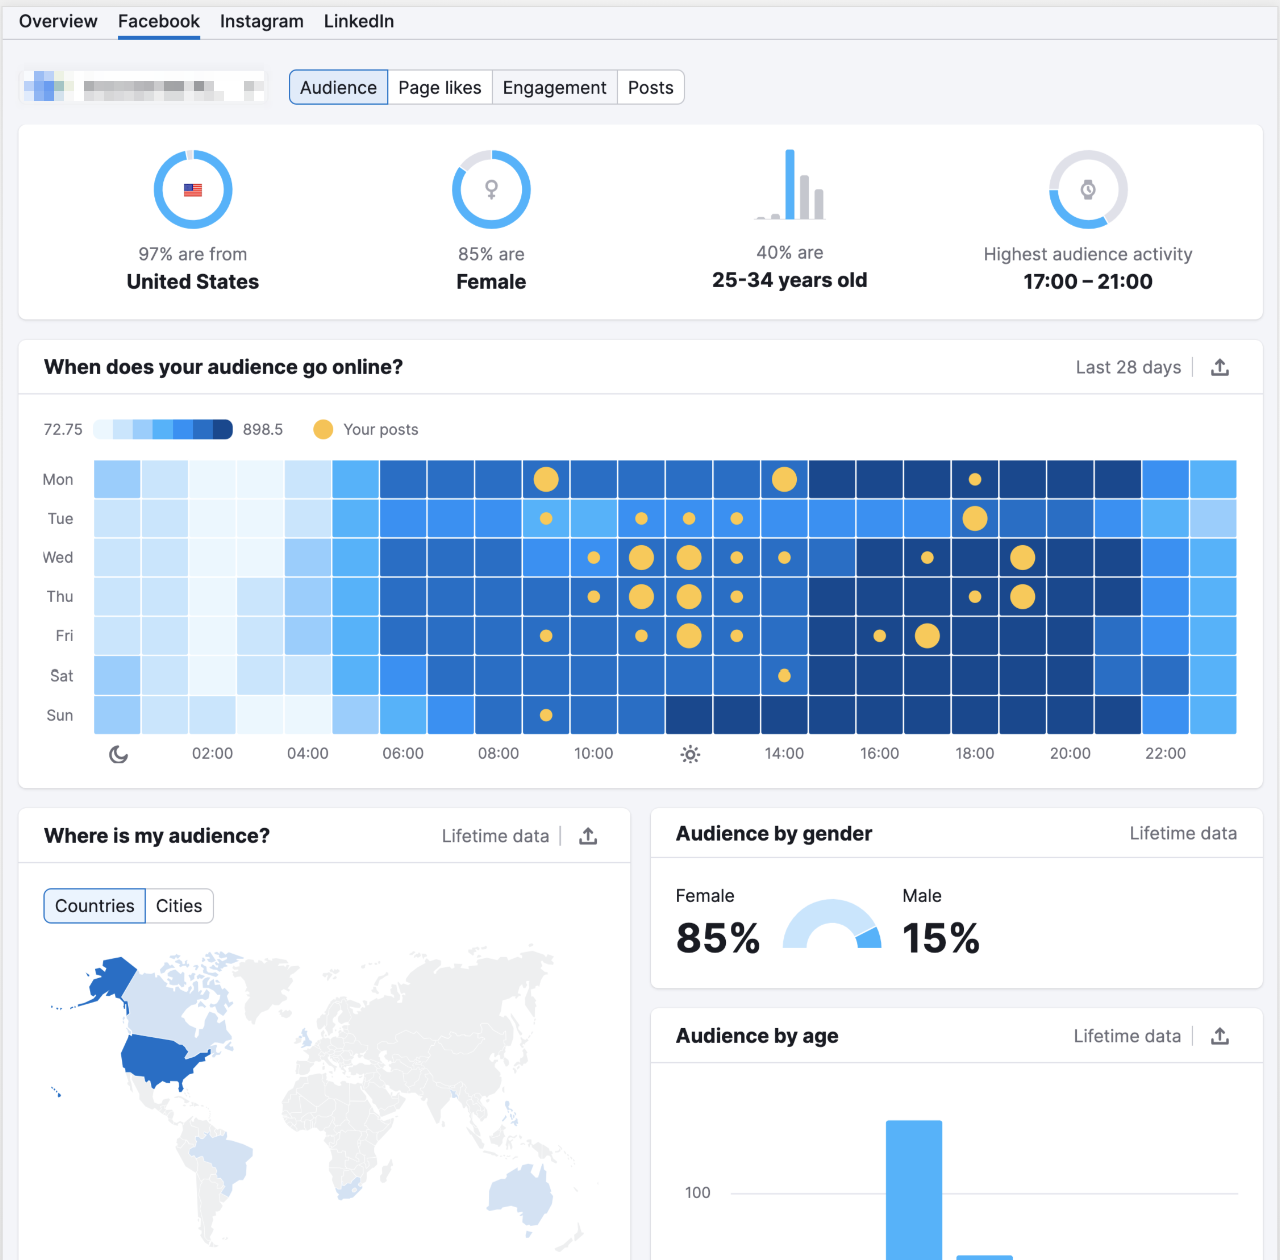
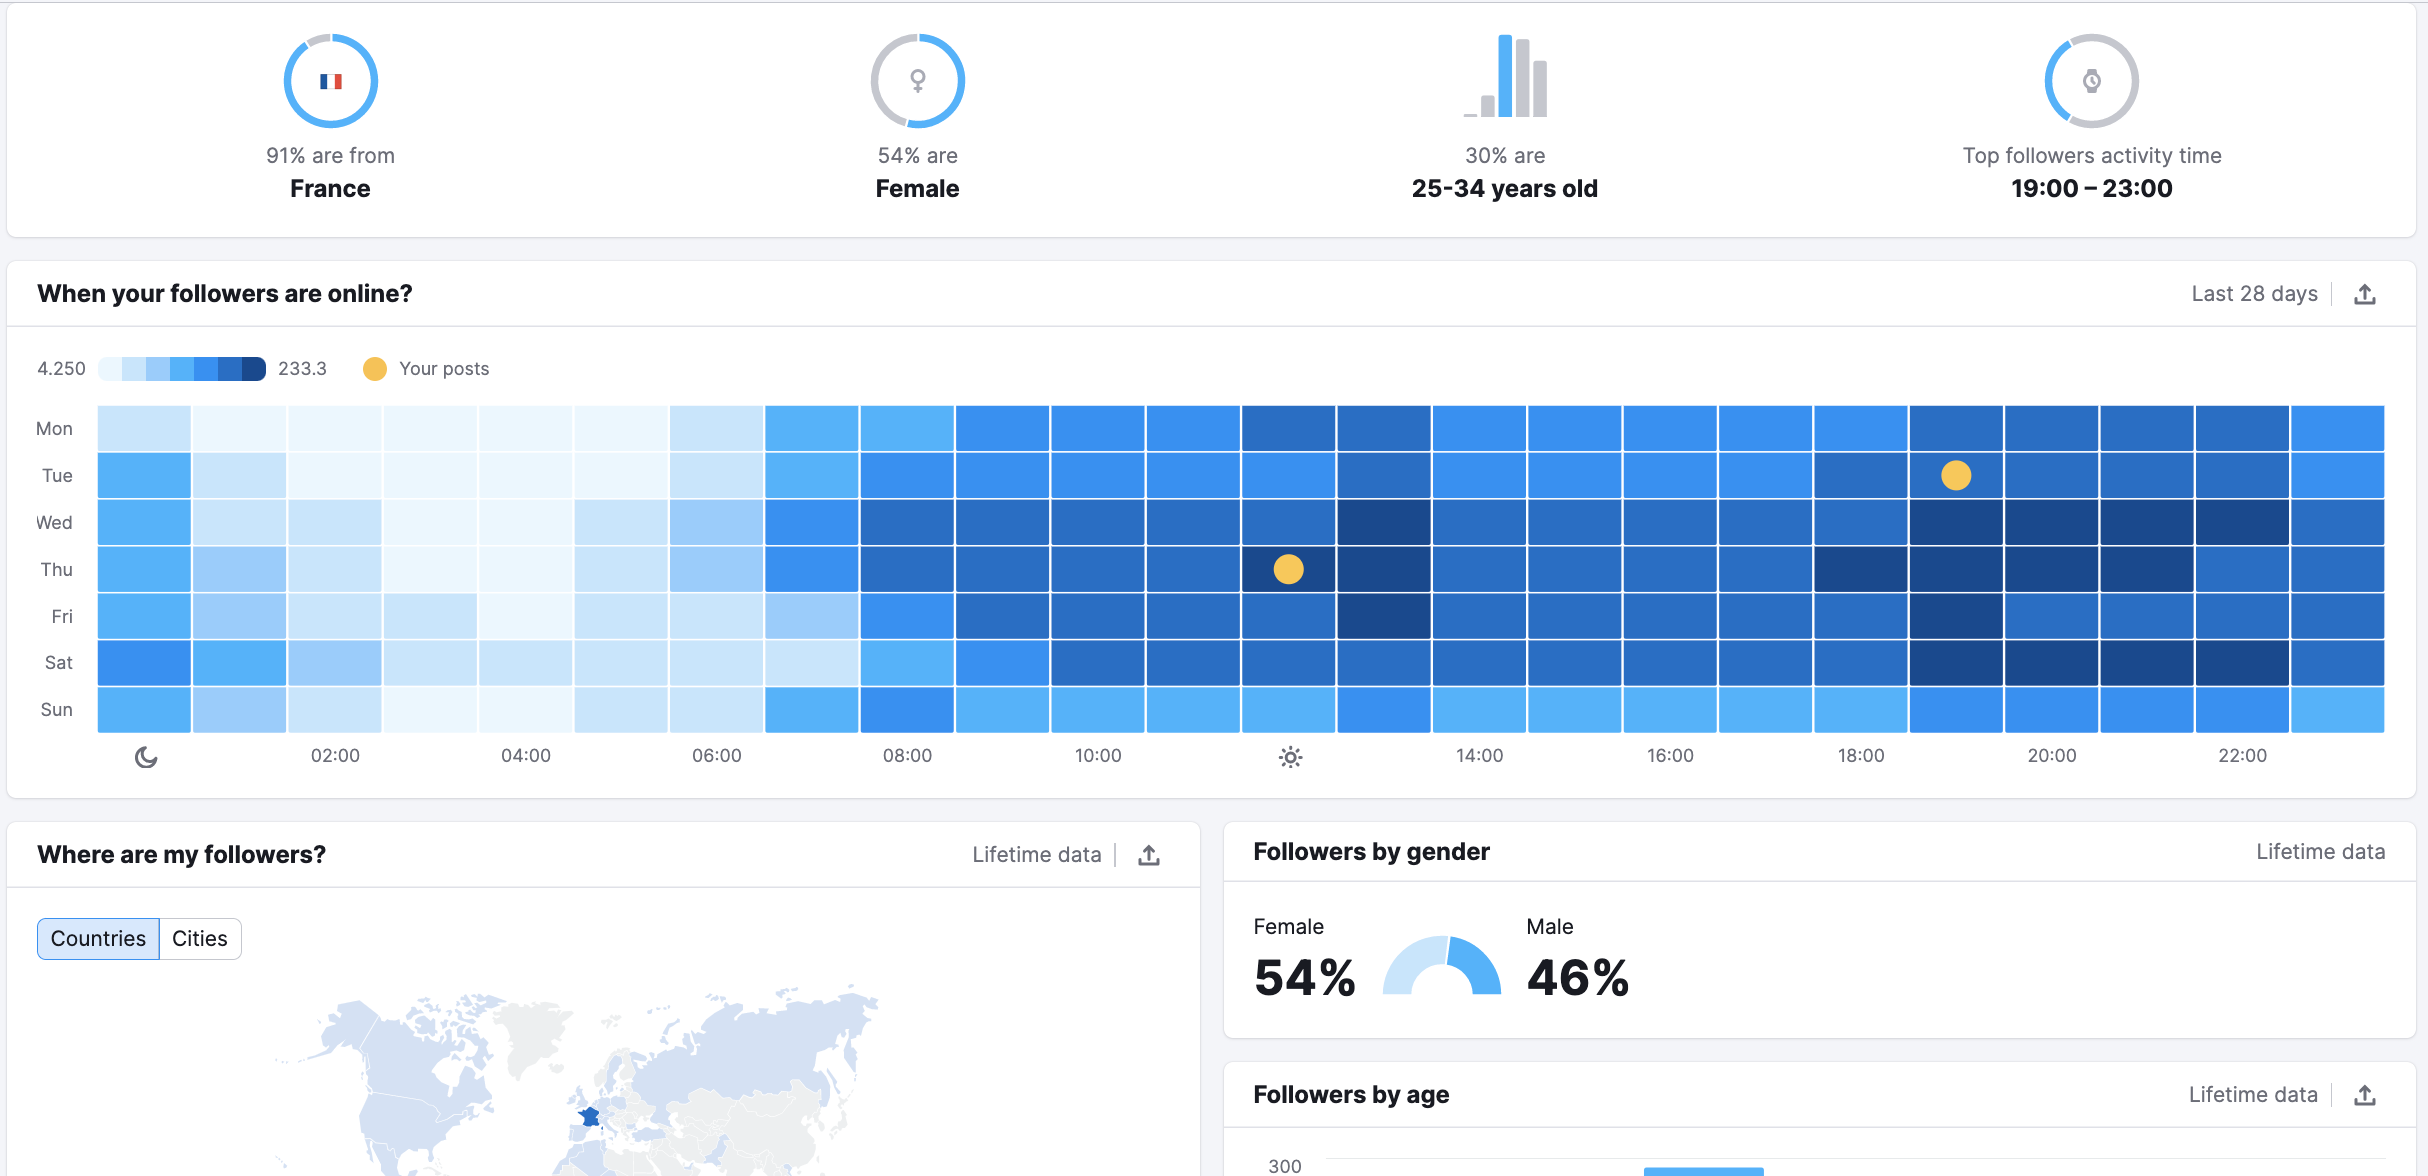
Audience
In the audience tab, you can see how your audience is broken down by country, gender, age, and what time they are most active on your site. Each of these metrics is broken down into its own widgets so you can get a greater understanding of how they break down.
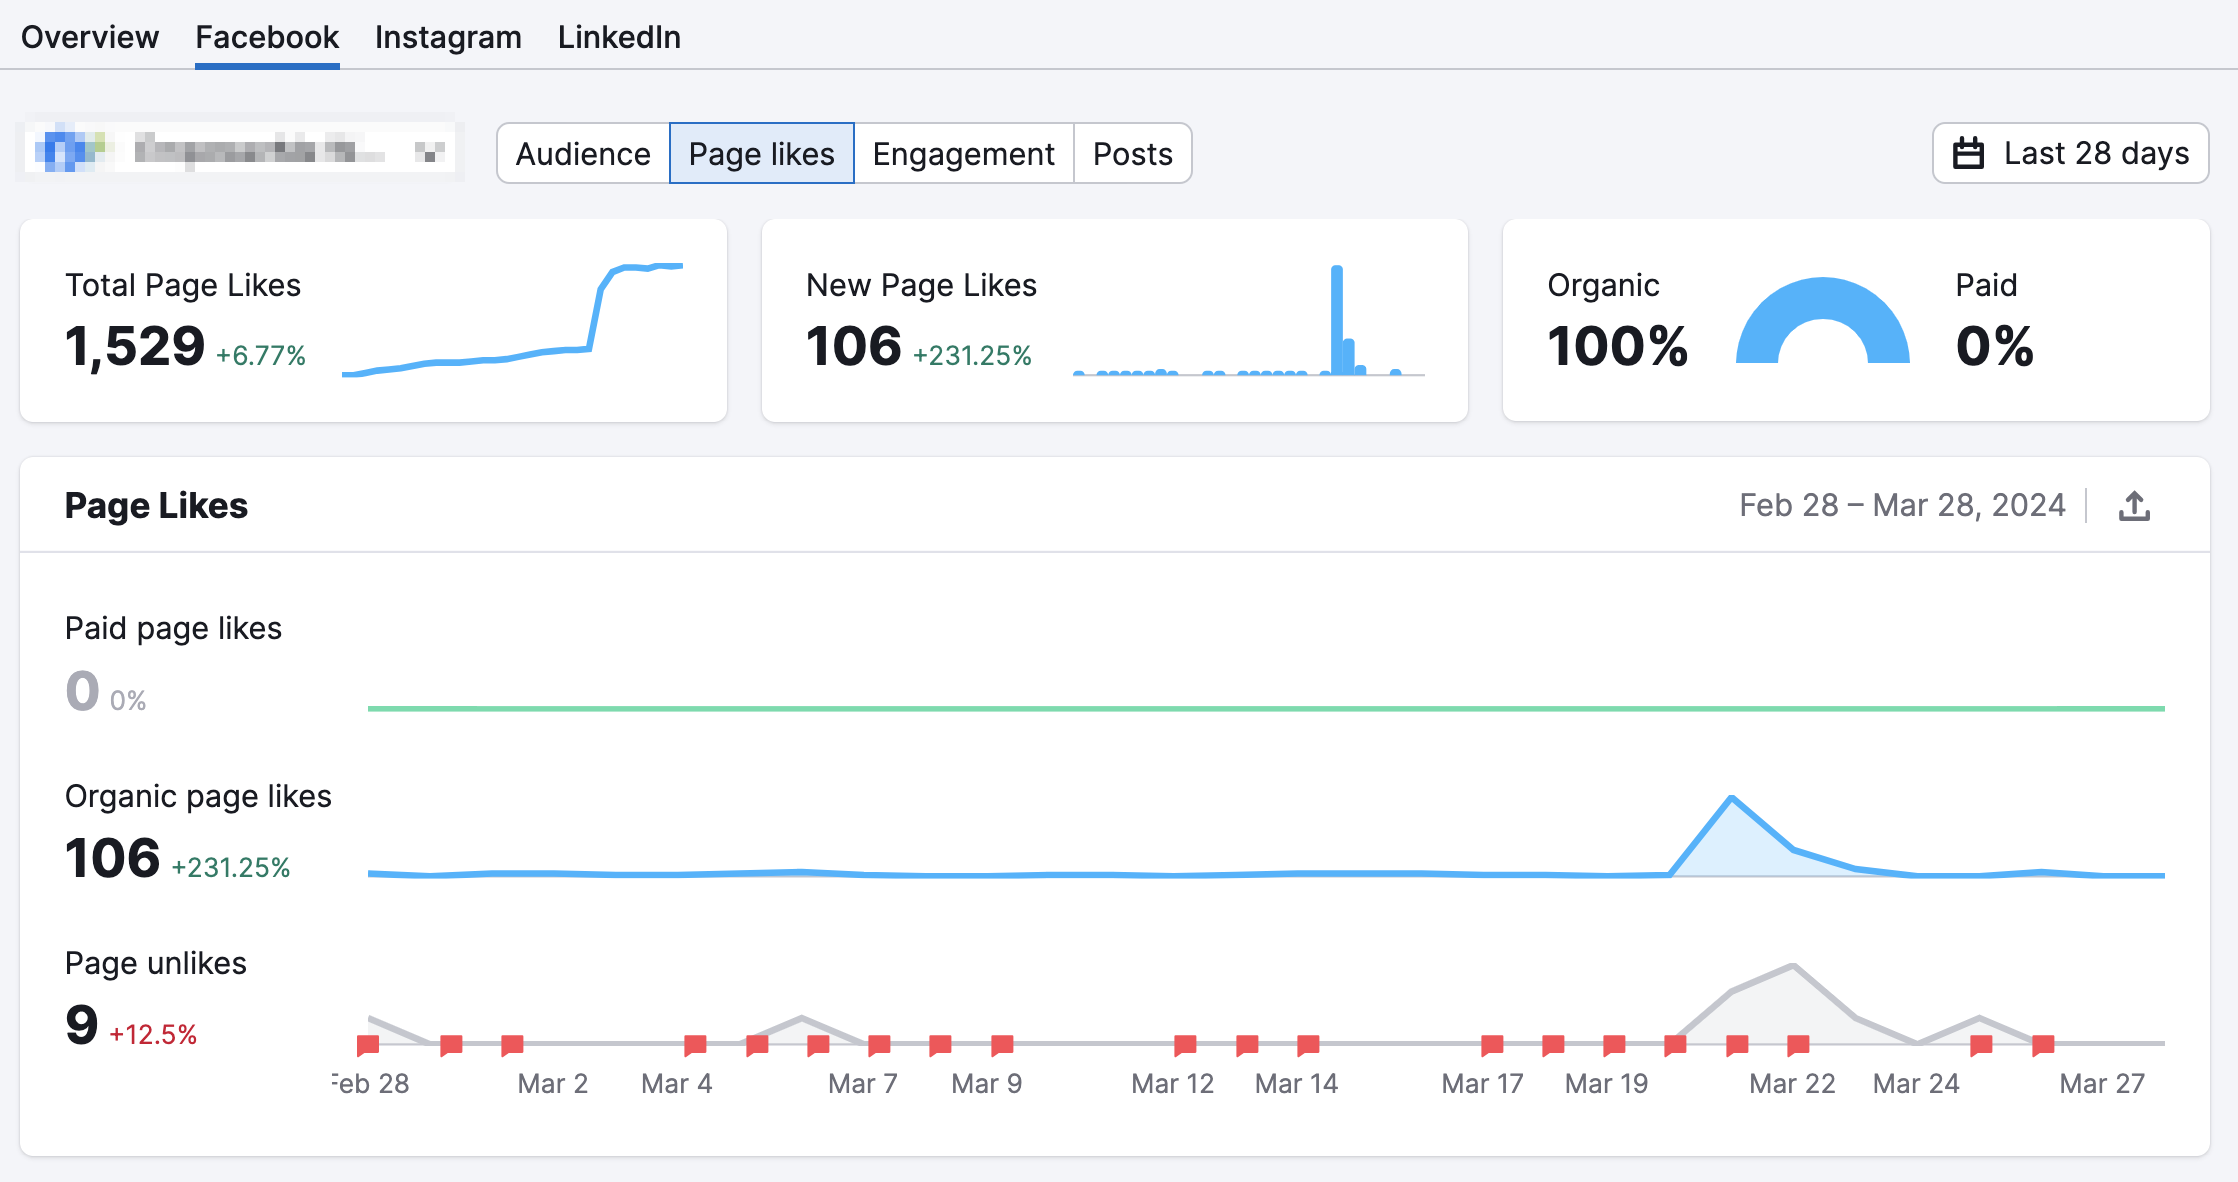
Page Likes
The Page Likes tab will let you see the distribution of your page's likes. This will show you your total page likes, new page likes, and organic and paid page likes.
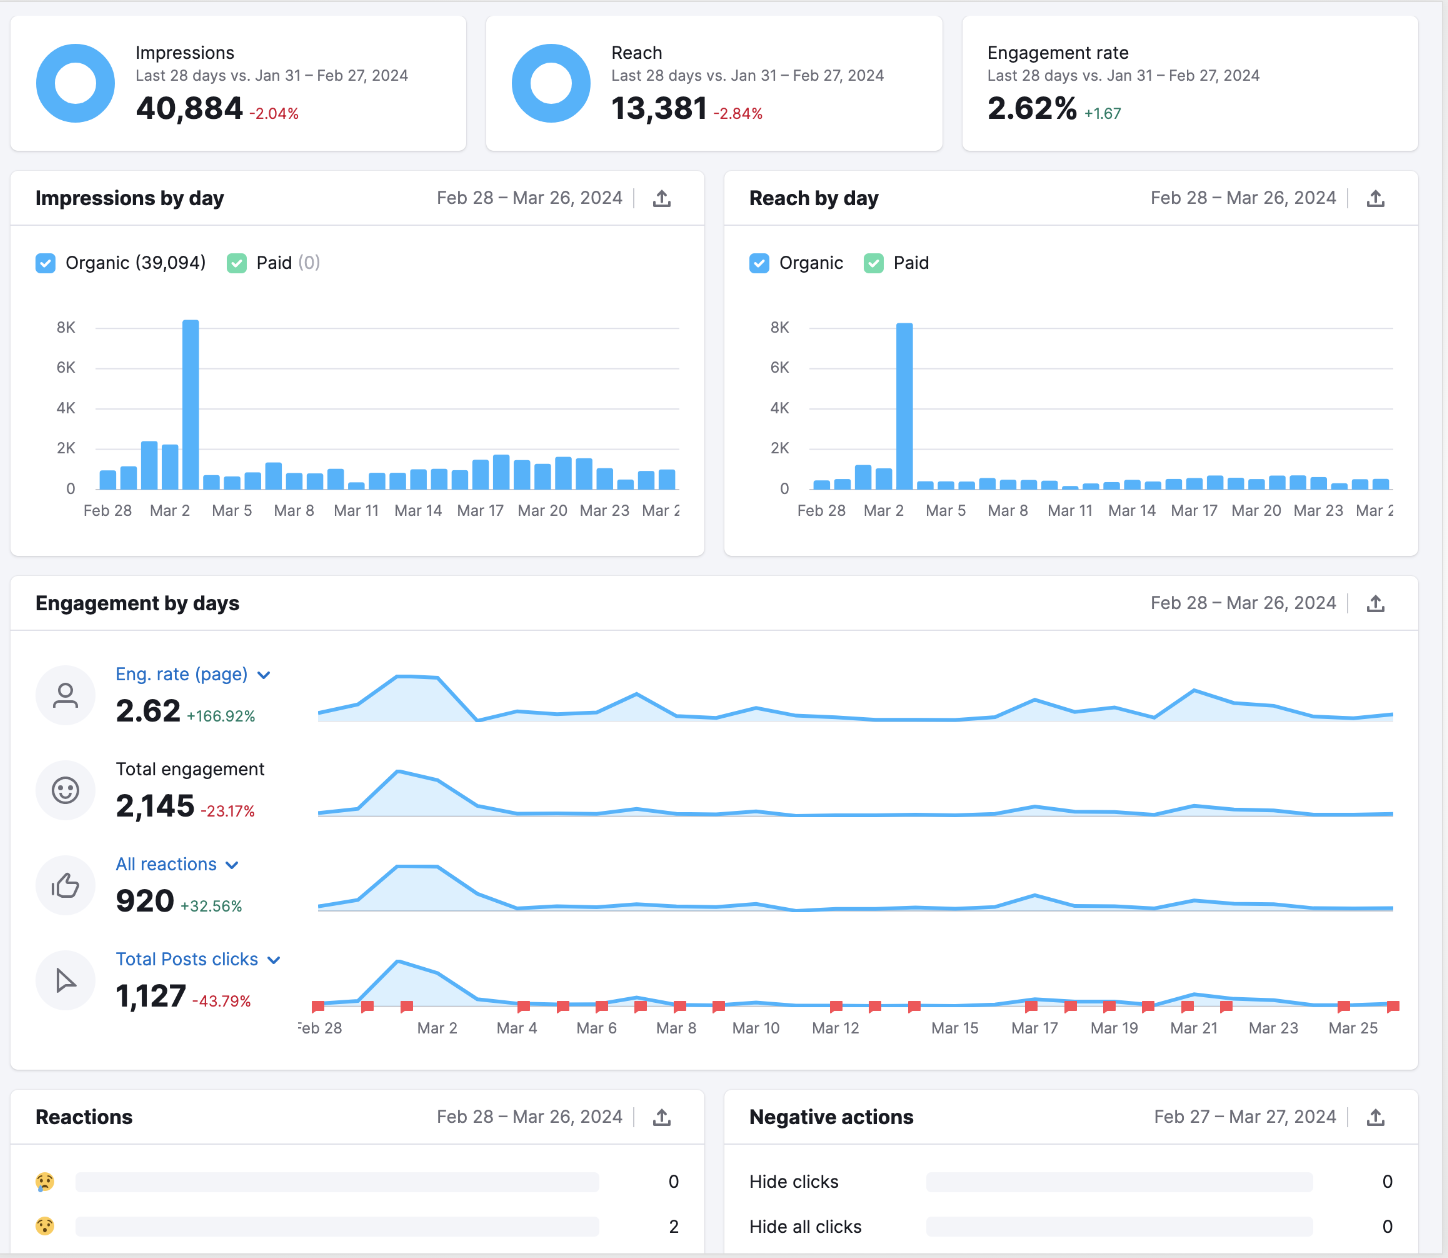
Engagement
At the top of the engagement tab, you’ll have three small widgets that show you your impressions, reach, and engagement rate. Just below these widgets, you have two bar graphs that break down your impressions by day and reach by day. Each of these widgets can be filtered by organic and paid results.
The engagement by day line graph lets you see your engagement rate, total engagement, all reactions (you can select one of them in the drop-down), and total post clicks over your given time frame.
Finally, at the bottom of the dashboard, you will find your breakdown of reactions as well as any negative reactions to your page.
Posts
In the Posts section, you will see two tables, top posts and posts that upset people. Your top posts can be filtered by engagement rate, link clicks, people,e and by reactions.
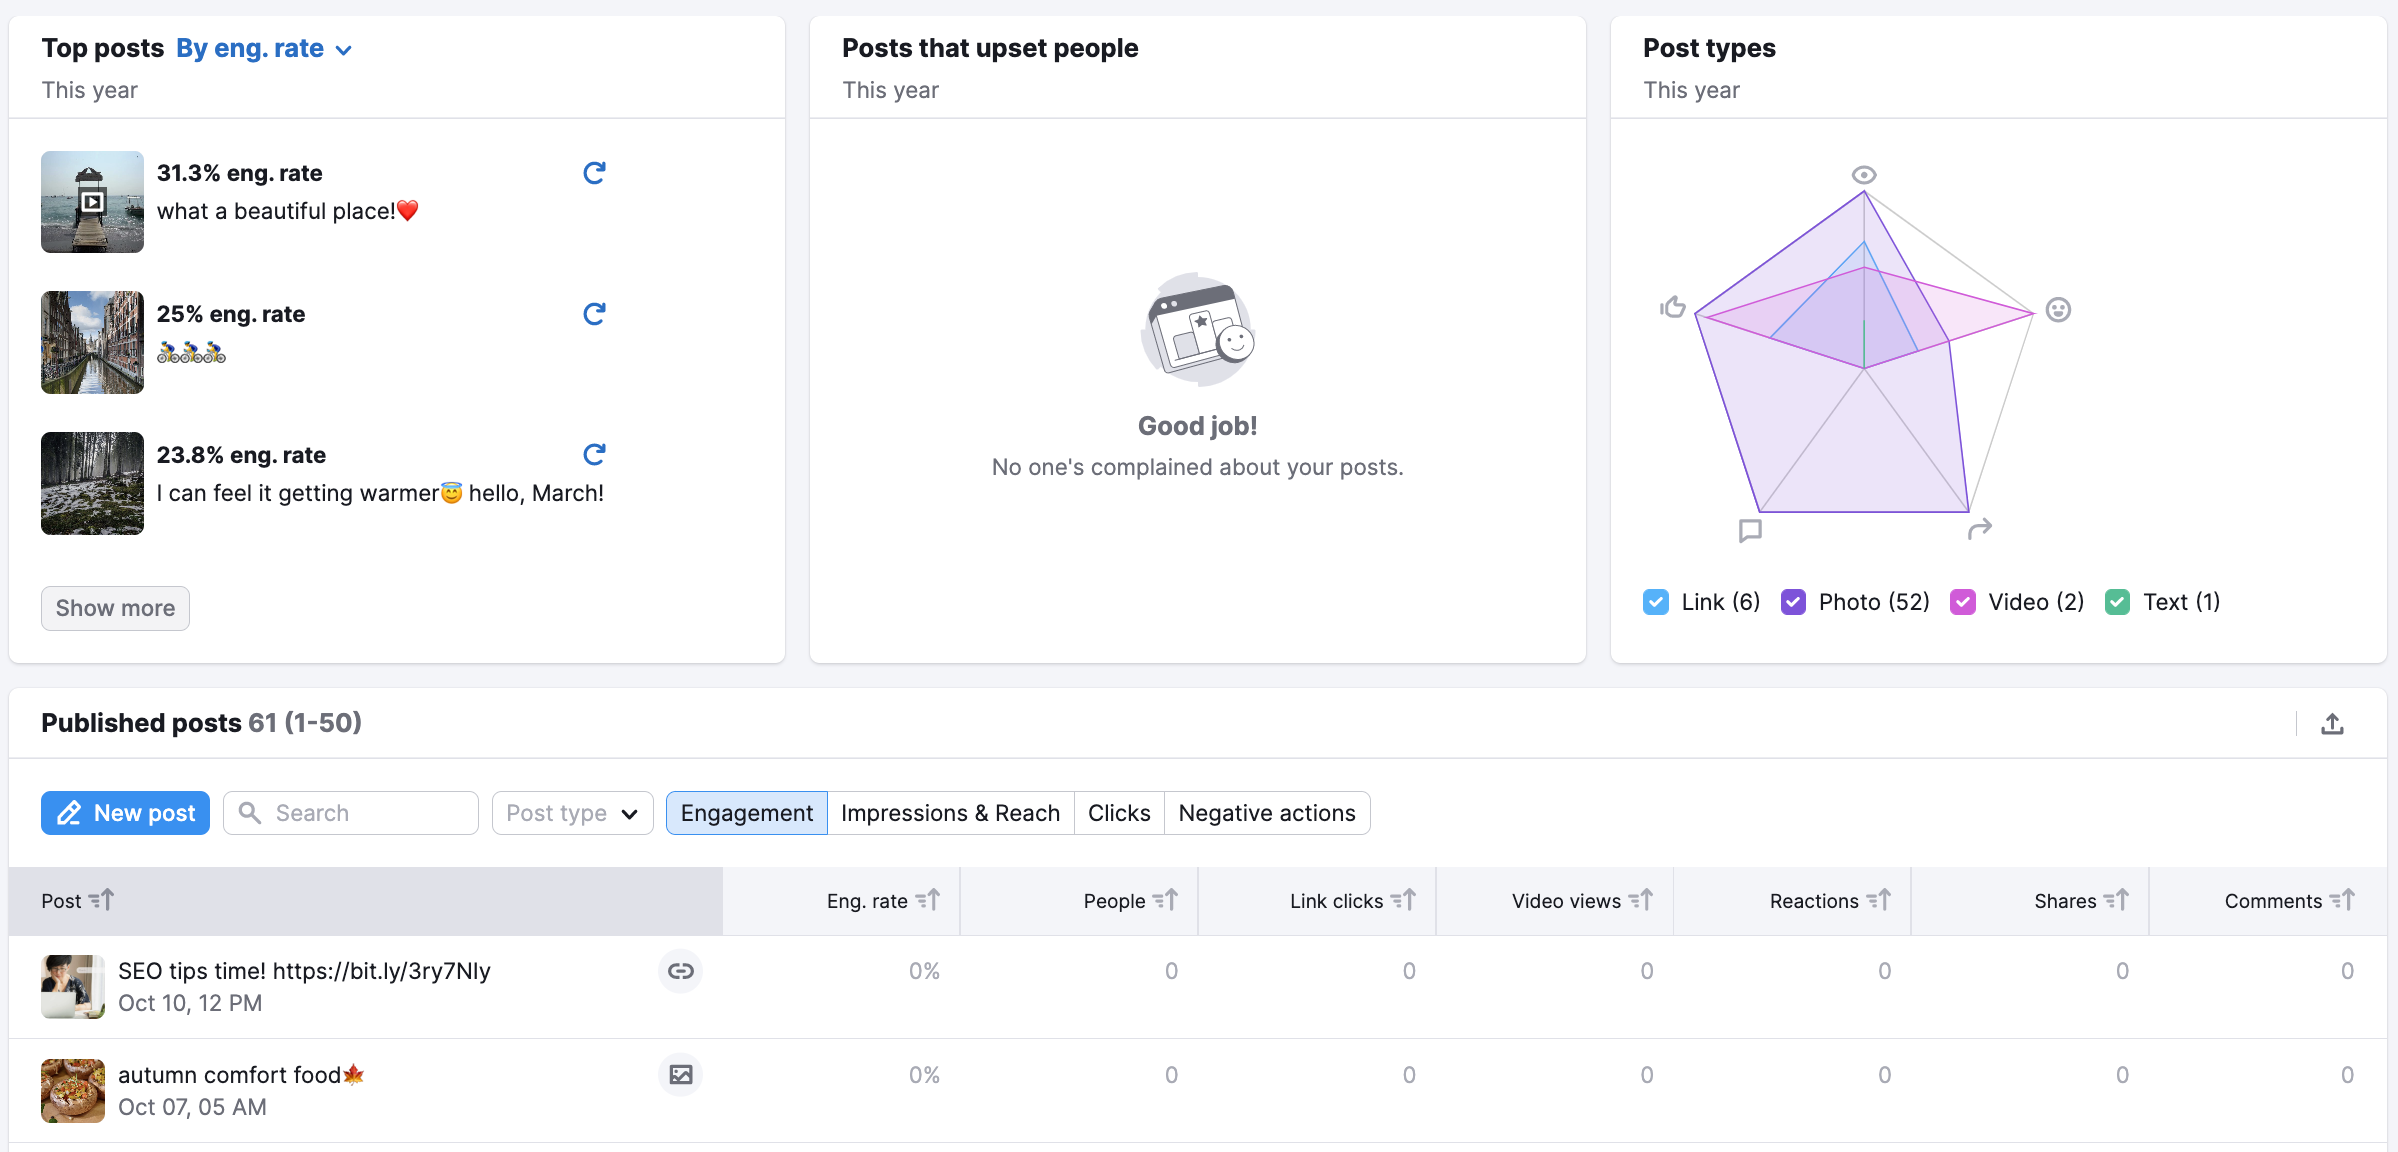
Top posts are determined by the following criteria:
Engagement Rate >= 2%
Number of people click on links >= 3
Number of people engaging with the post >= 3
Number of people reacting to the post >= 5
Upsetting posts are:
Posts where people reacted negatively, hid the post, hid all posts from a specific page, or reported the post as spam.
Your published posts at the bottom of the dashboard will let you filter your posts by engagement, impressions & reach, clicks, and negative reactions. From here, your posts can be filtered by engagement rate, people, link clicks, video views, reactions, shares, and comments.
Similar to Facebook, the Instagram report is divided into four sections: Audience, Profile Interactions, Posts, and Stories.
Audience
Under the audience tab, you can see the breakdown of your followers by country, gender, age, and what time they are most active. Each of these metrics has its own widget.
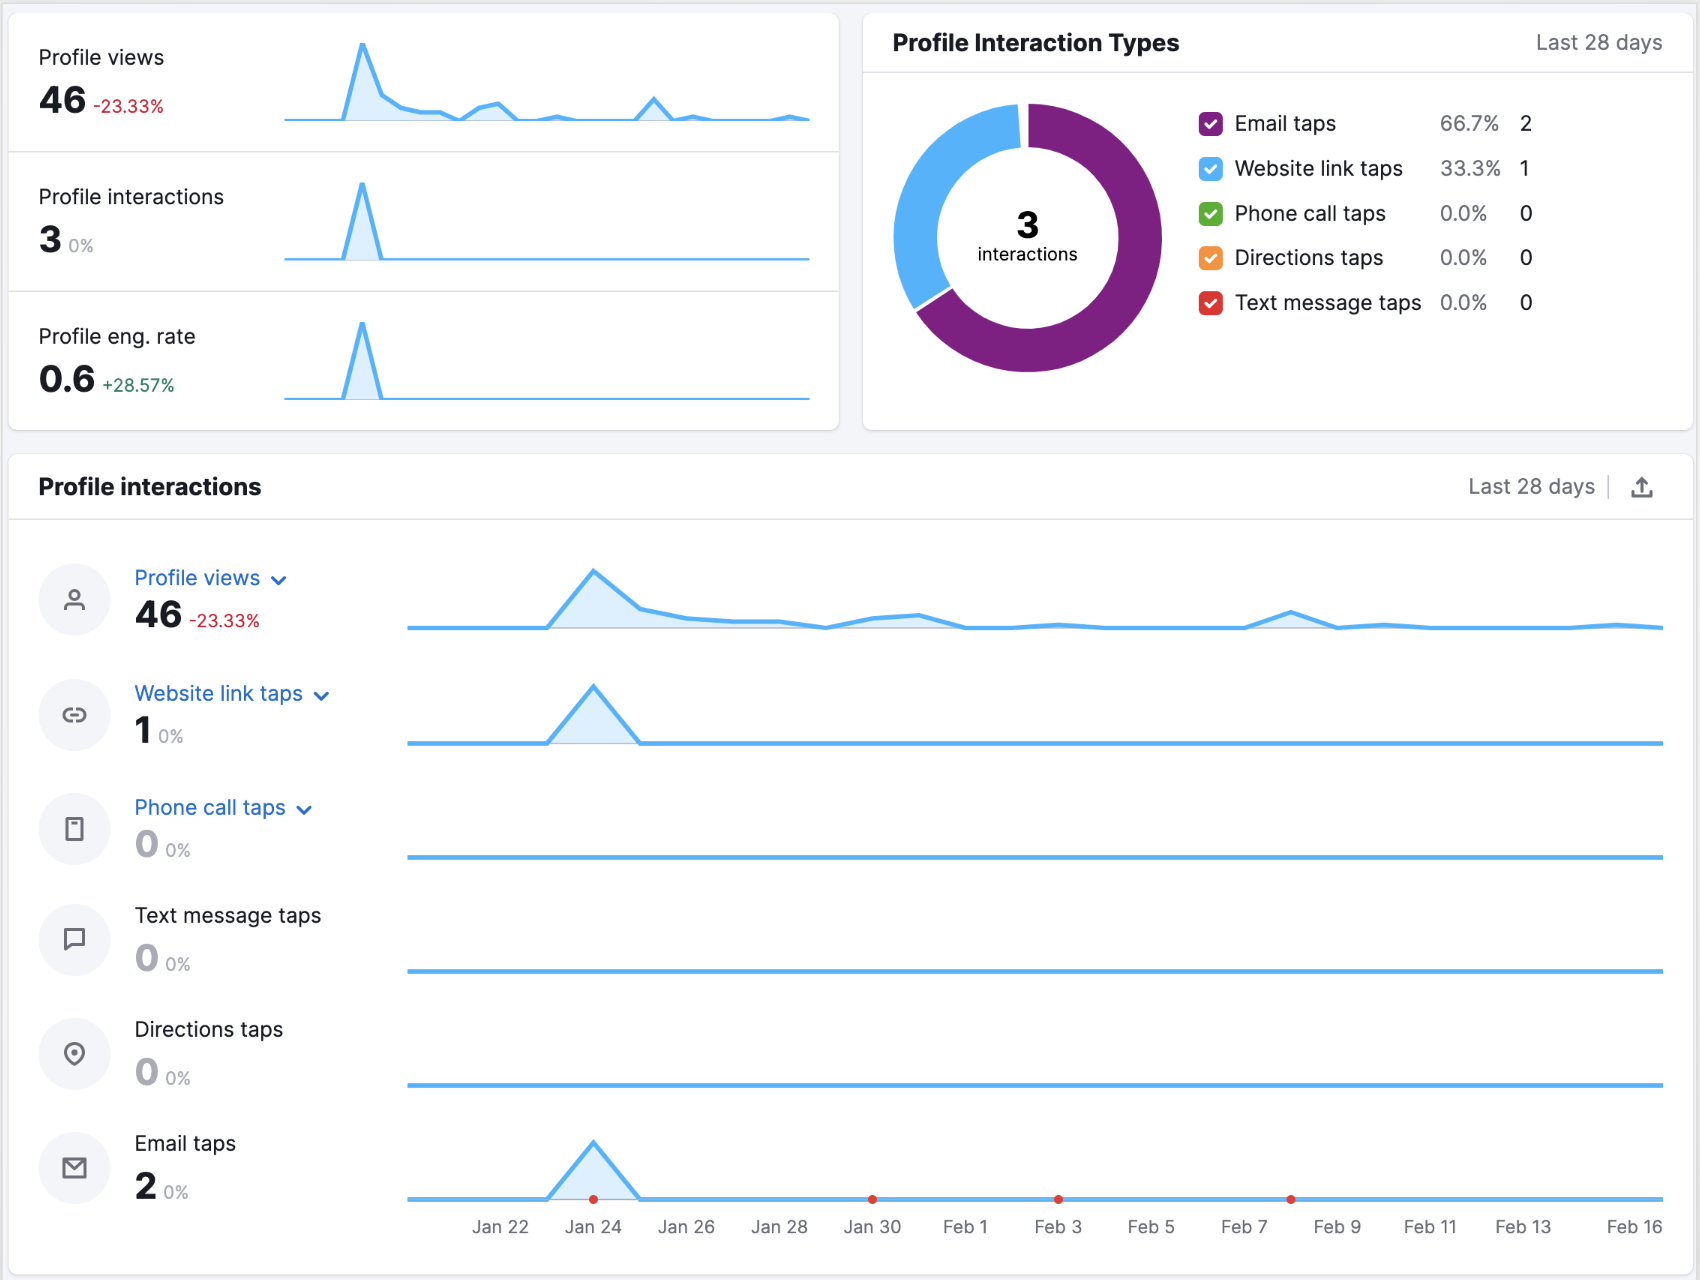
Profile Interactions
Profile Interactions tab allows you to see all of your profile interactions. These include profile reach and clicks on CTAs like getting directions, website, phone calls, emails, and text messages.
Posts
The Posts tab lets you analyze a table of your Instagram posts. By default, posts are sorted by the date they were published (with the most recent one at the top). The Posts type selector lets you filter the table to show you only photos, videos, carousels, or reels. You can also search to find specific posts.
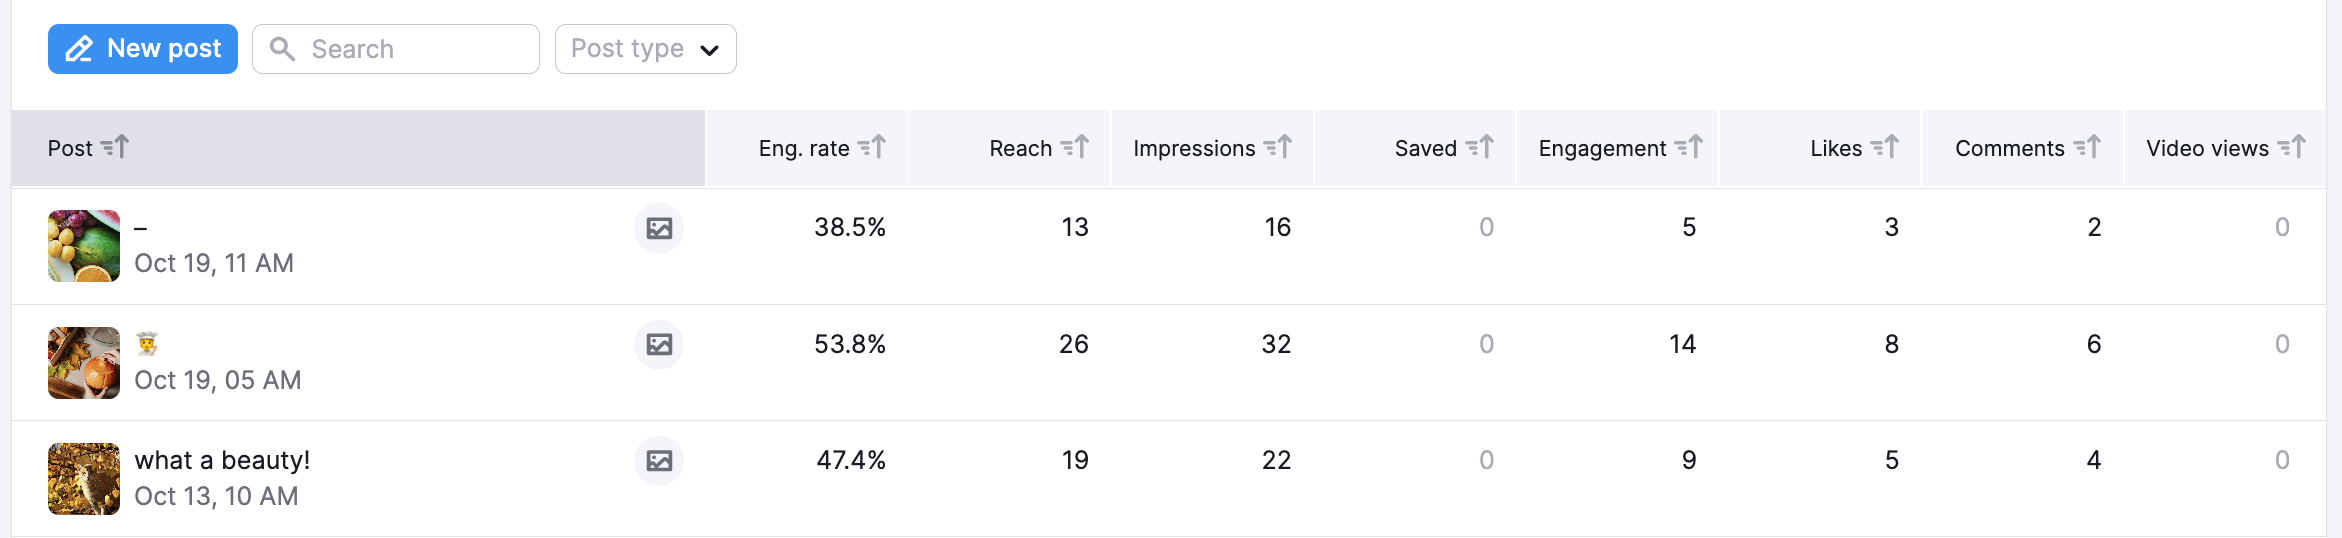
To change the sorting order of the posts, you can select any of the corresponding column headers:
Engagement rate — the total amount of all likes and comments on the post divided by the number of people who saw the post (over the set date range).
Reach — the number of unique Instagram accounts that have seen the post.
Impressions — the total number of times the post has been viewed.
Saved — the number of accounts that have saved the post.
Engagement — total number of likes and comments on the post.
Likes — the total number of likes on the Instagram post.
Comments — the total number of comments on the Instagram post.
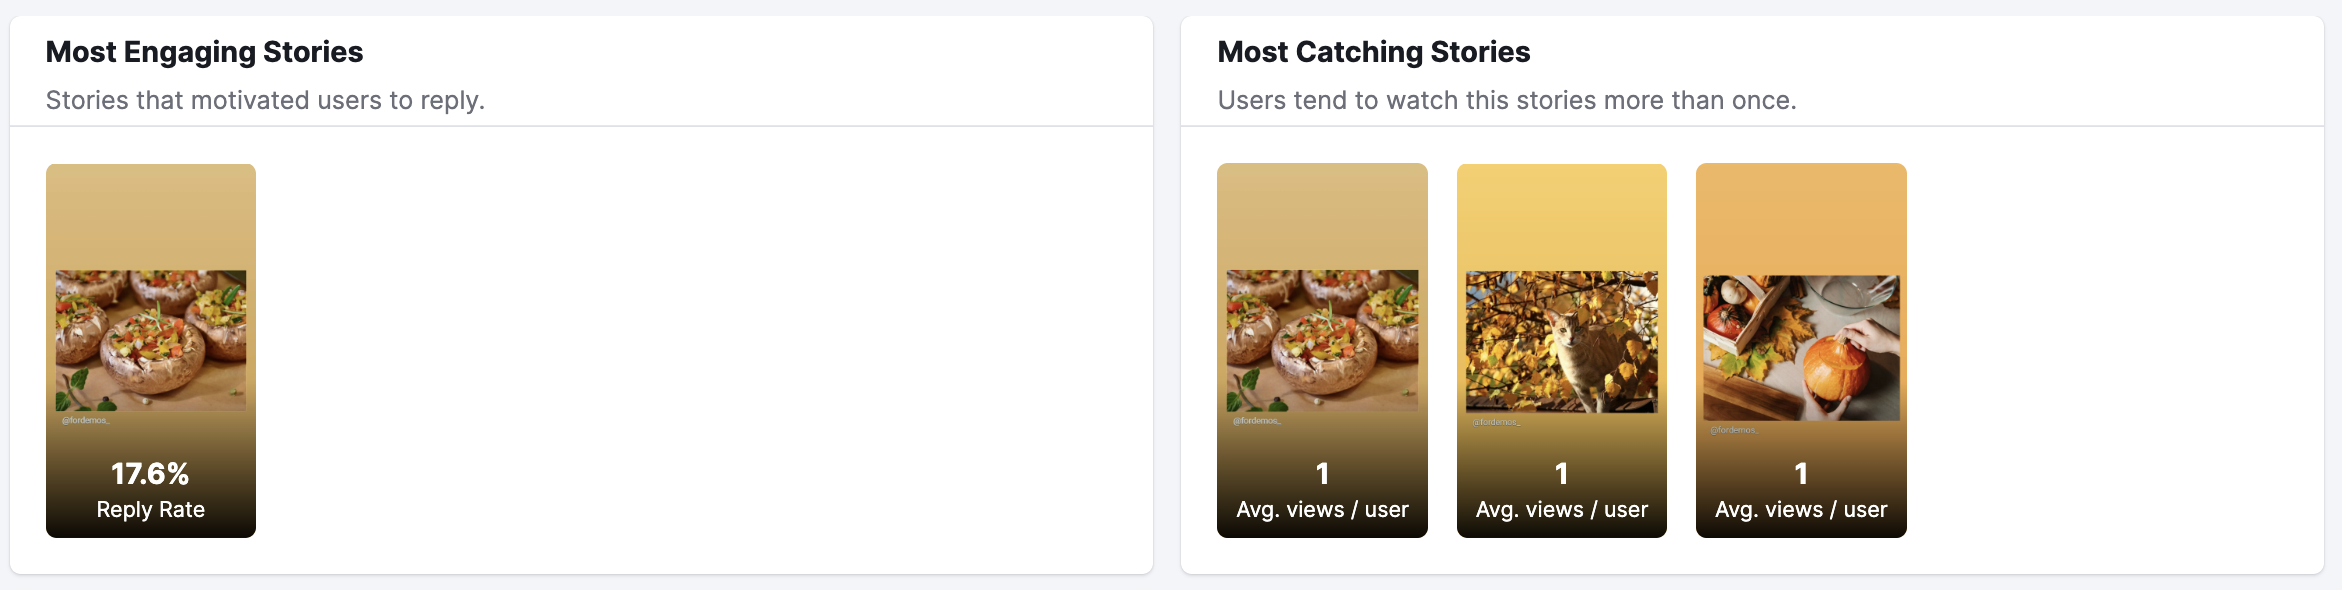
Stories
In the Stories section, you will see your Most Engaging (motivated users to reply) and Most Catching (users tend to watch them more than once) stories.
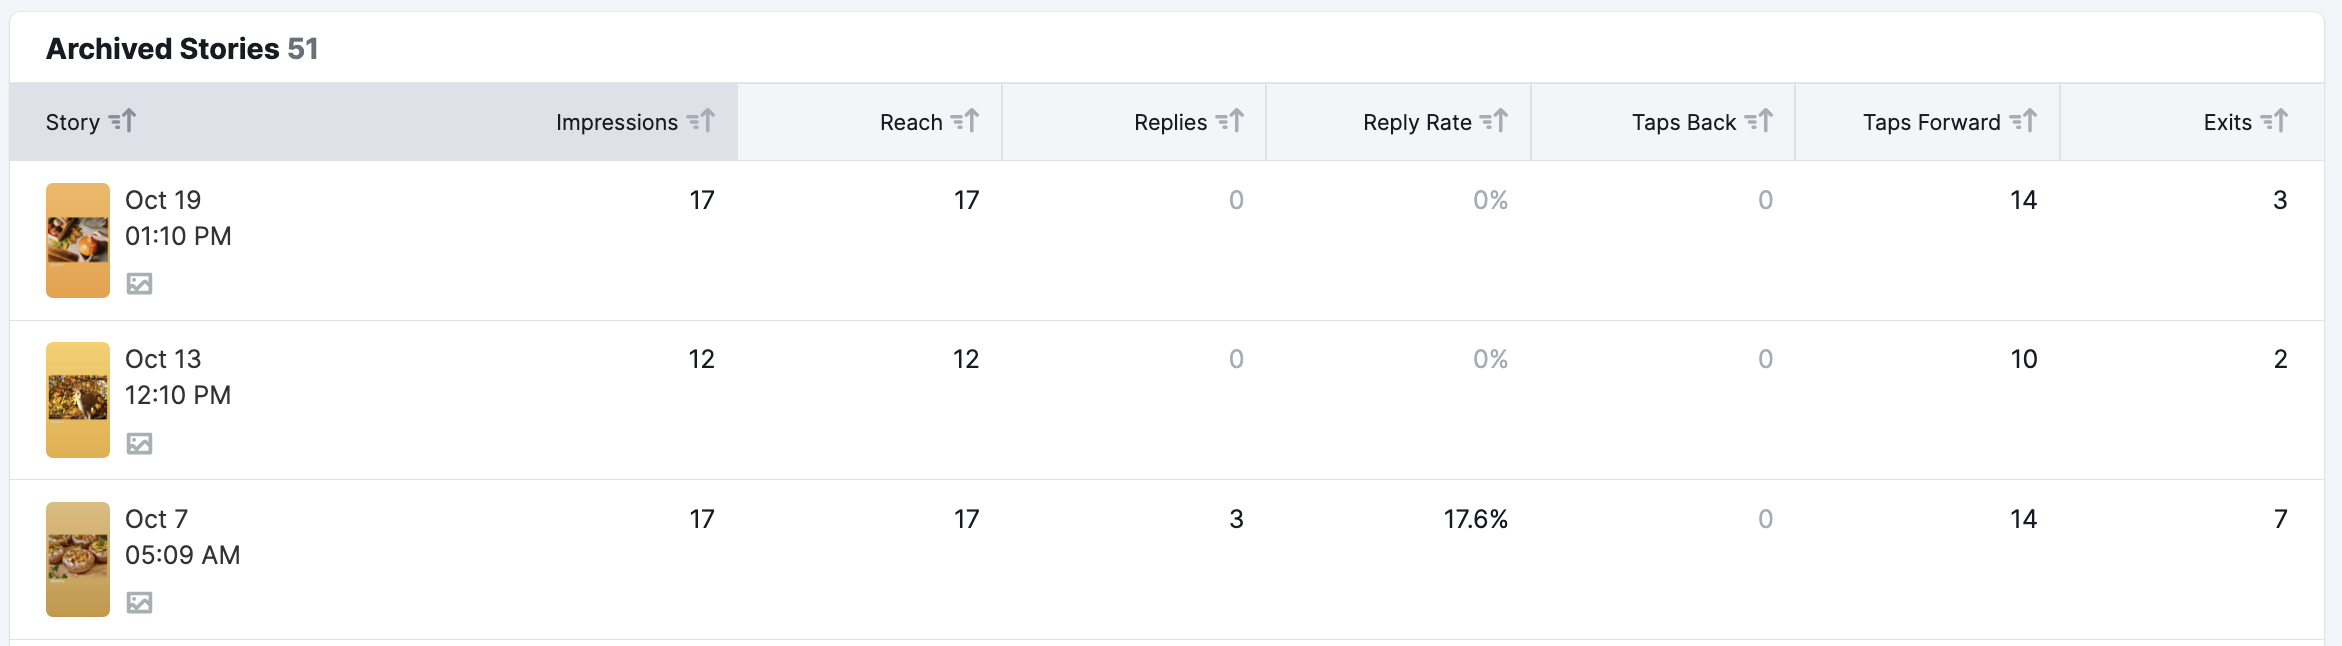
Below the Most Engaging and Most Catching stories widgets, you’ll find two tables with your active and archived stories with engagement metrics for each post: Impressions, Reach, Replies, Reply rate, Taps back/forward, and Exits.
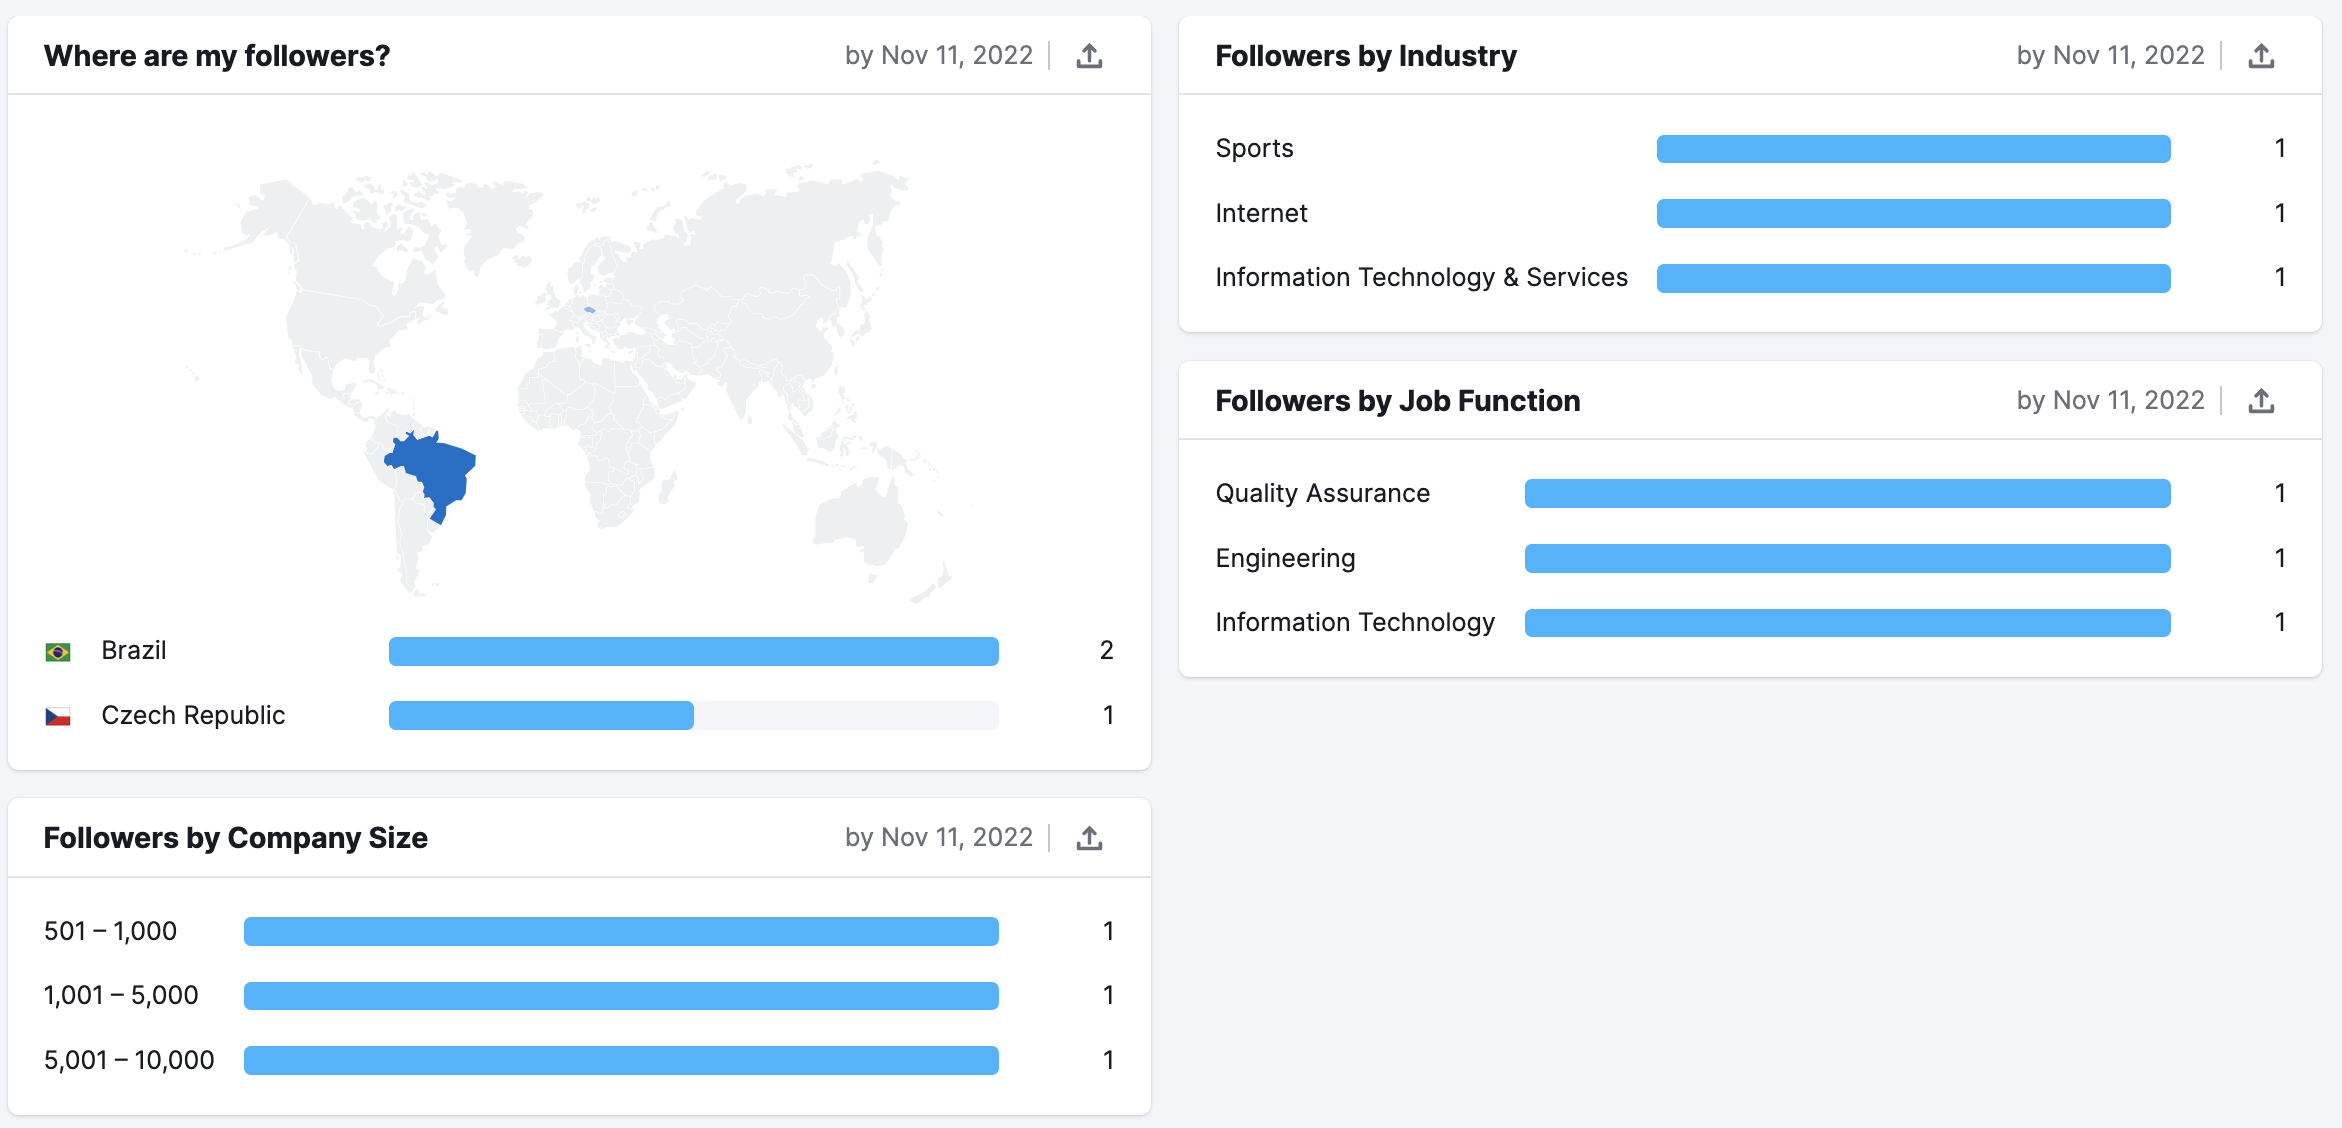
Linked report is divided into three sections: Audience, Engagement, and Posts.
Audience
Similar to two previous reports, here you can see the breakdown of your followers by country, industry, job function, and company size:
Engagement
Under the Engagement tab, you will see:
- Total Followers
- Followers gained compared to the previous period
- Average engagement rate growth — Engagement rate represents the total number of likes and comments on the post, divided by number of people who saw the post, multiplied by 100
- Reach — the number of unique accounts that have seen your posts
- Impressions — the total number of times posts have been viewed.
- Engagement — clicks, reactions, comments and shares
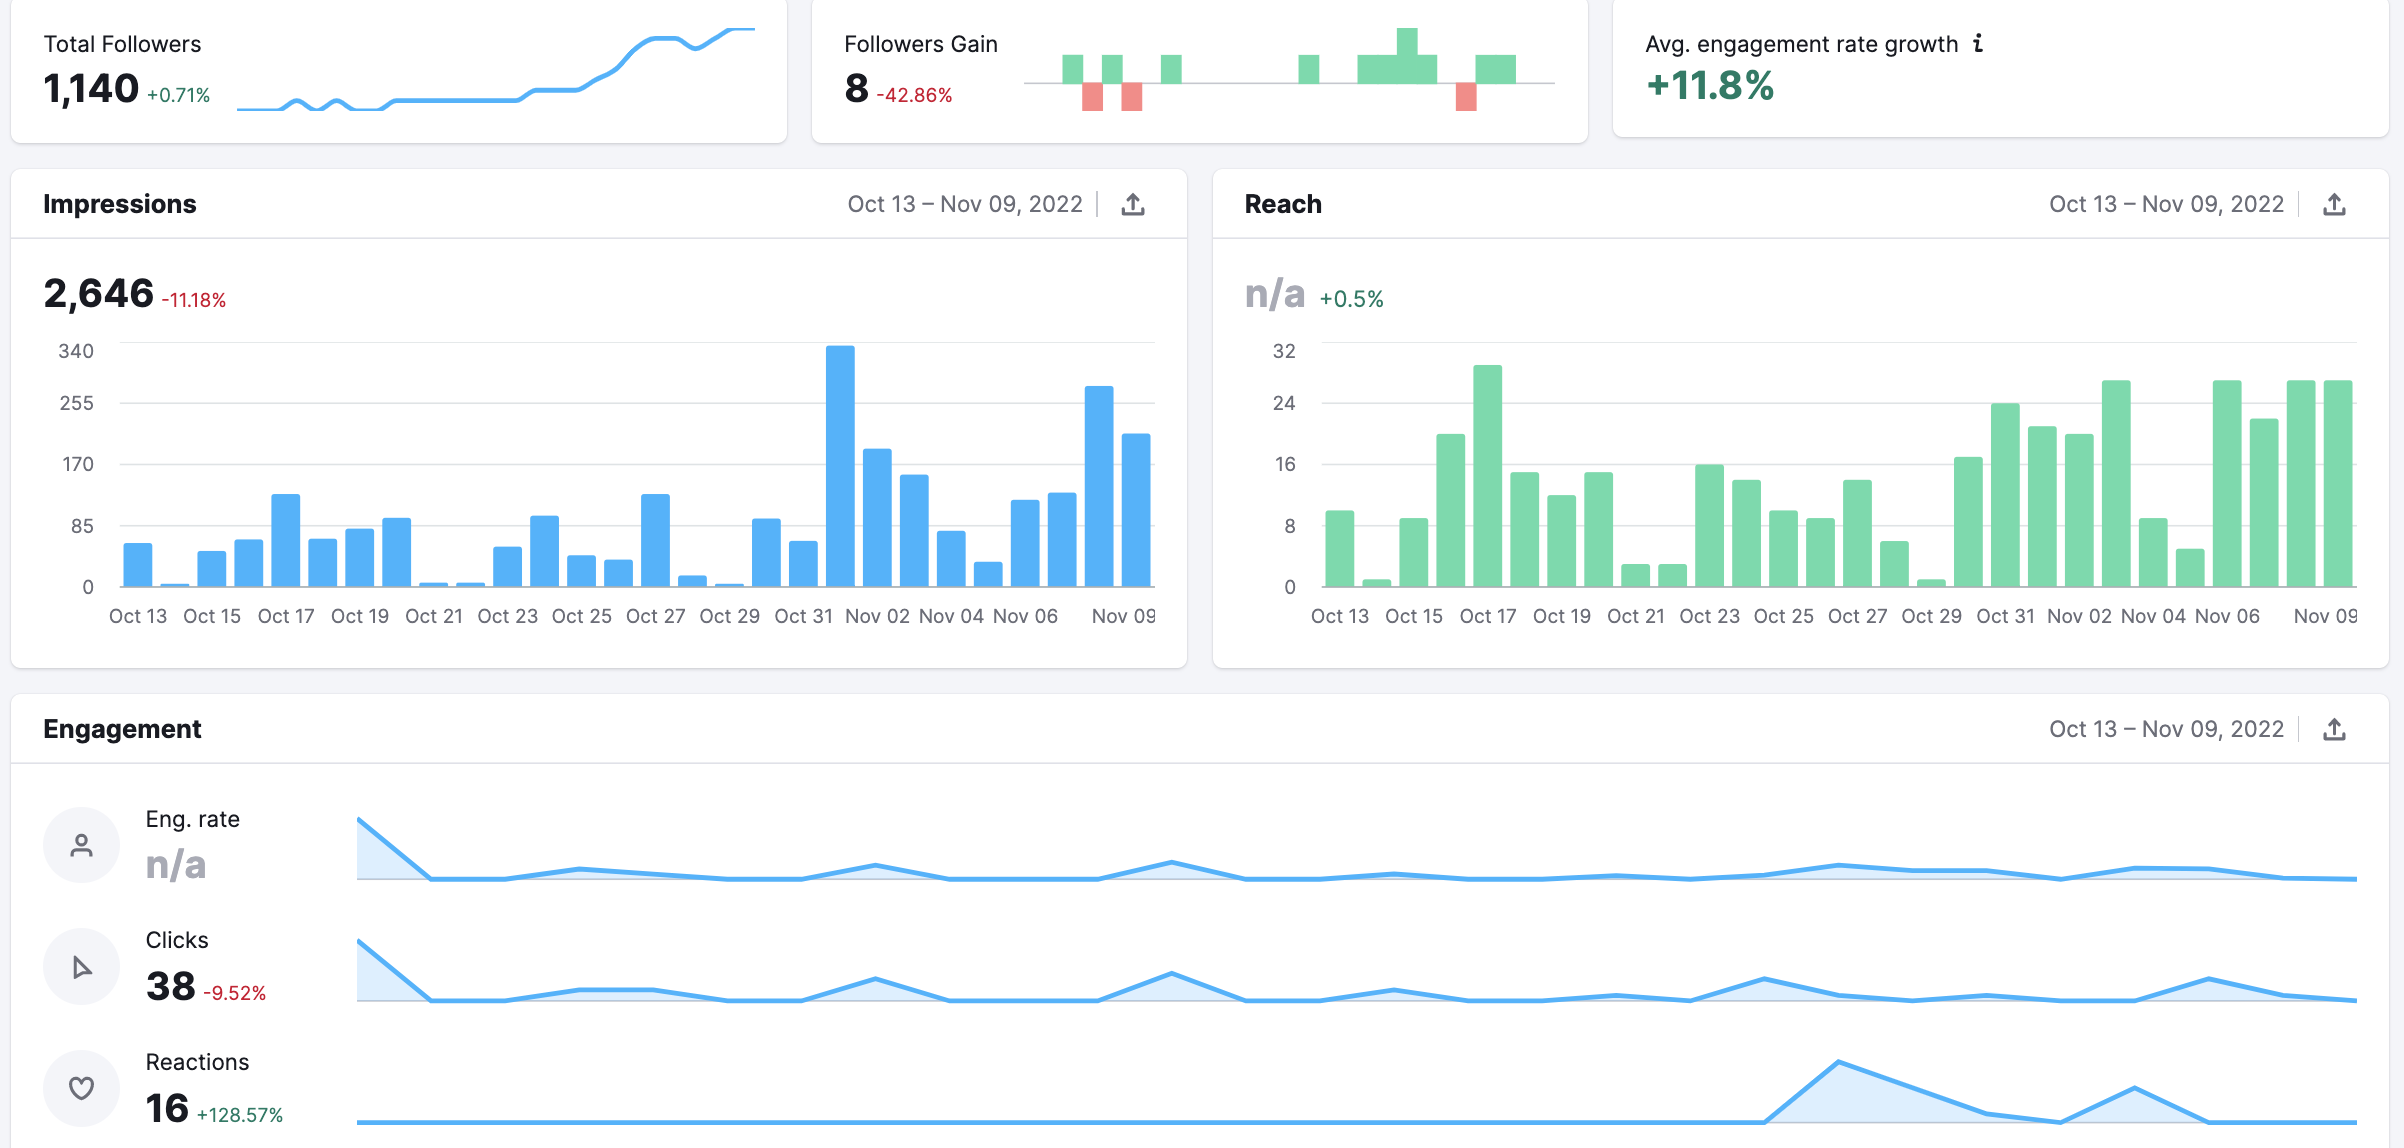
Please note that total Reach and total Engagement rate metrics are not available due to LinkedIn API restrictions.
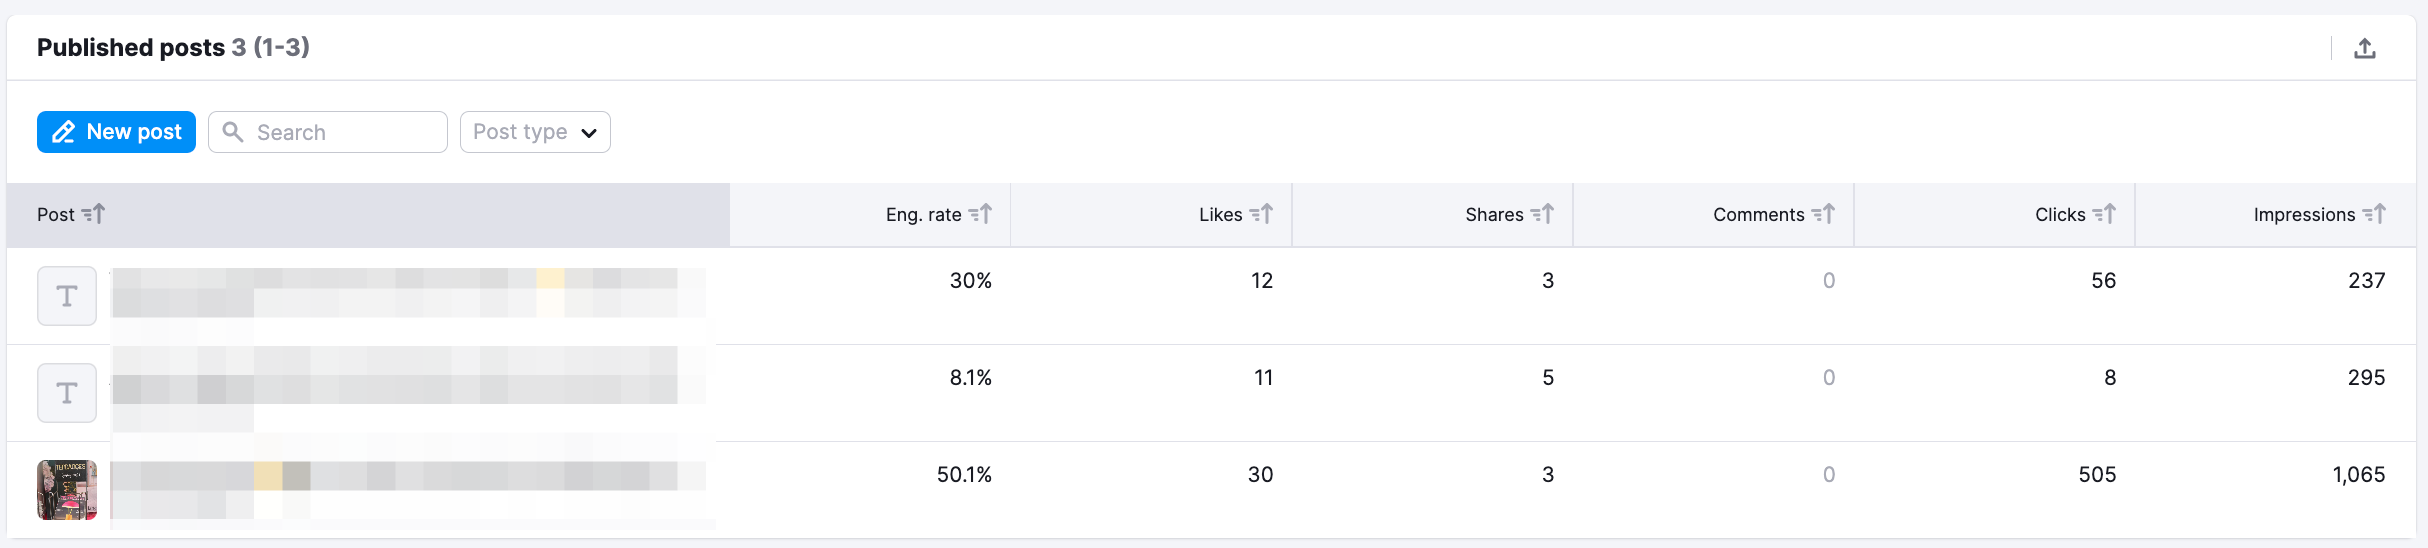
Posts
Posts section provides insights into your published post. You can check the engagement (likes, shares, comments, and clicks), engagement rate, and impressions for each post.