The strength of Instagram is in the ability to communicate with an audience through visual storytelling. Brands that do well on Instagram post engaging images that expand their image in the eyes of their customers. It’s a great opportunity to grow your brand, display your company culture, and interact with your community, especially if you are on a budget.
With an Instagram Business account, the Social Tracker can help you:
- Track your Instagram account’s progress alongside your competitors
- Compare audience growth and engagement rates between competitors
- Identify your competitor’s posting trends
- See top posts and hashtags for a period of time
- Understand audience behavior and engagement habits
Settings and Navigation
The Instagram report functions in a similar way as the Facebook report. There are five subsections to analyze your competitors’ activity: Posts, Audience, Activity, Engagement, and Hashtags.

By default, the tool will show data on your main profile over the last 28 days but this can be changed with the Company (1) and date settings (2) above the table. You can view a single competitor or “All profiles” in the Company drop down to analyze the top Instagram posts between all of your competitors.
To add competitors or change your main tracked account, use the settings gear and select “Manage Competitors” or “Manage social accounts of the main domain.”

Keep in mind that because Social Tracker only analyzes Instagram Business accounts, your competitors must also have an Instagram business account in order to analyze their data.
Posts
The first subsection lets you analyze a table of Instagram posts. View posts from a single competitor or “All profiles” with the company drop down. By default, the table sorts posts in order of their Total Engagement. The Posts types selector lets you filter the table to show only specific types of posts depending on social media. For example, you filter by images, videos, reels, or carousels in Instagram, but for Facebook, choice will be different.
You can also filter by hashtags to find all posts using a specific hashtag.

To change the sorting order of the posts, you can select any of the corresponding column headers:
- Published: when the Instagram post was published by the profile.
- Total engagement: the sum of all likes and comments on the post.
- Engagement rate: the rate of all likes and comments on the post over the set date range.
- Likes: the total number of likes on the Instagram post.
- Comments: the total number of comments on the Instagram post.
Each post can be expanded in the interface by clicking on the expand button or the Instagram image itself.
Audience
Here you can compare total Instagram audiences (number of followers) as well as audience change and growth. This subsection can only be viewed for one company at a time.
The data will be based on the set date range at the top. If you set the range to the past week, you will see growth over a week’s time. If you set the range to the past 90 days, you will see the growth over the past three months.
Followers Trend
The follower's trend lets you plot out the audience’s growth over time. The blue line graph represents the profile’s overall audience size, and the green bar and red bar graph below represents the amount of new or lost followers that joined the profile’s audience each day.
If you set a custom comparison, the compared date range will be shown in dotted lines. You can add Activity and Engagement metrics to the line graph to enhance the visual appeal and depth of the data.
![]()
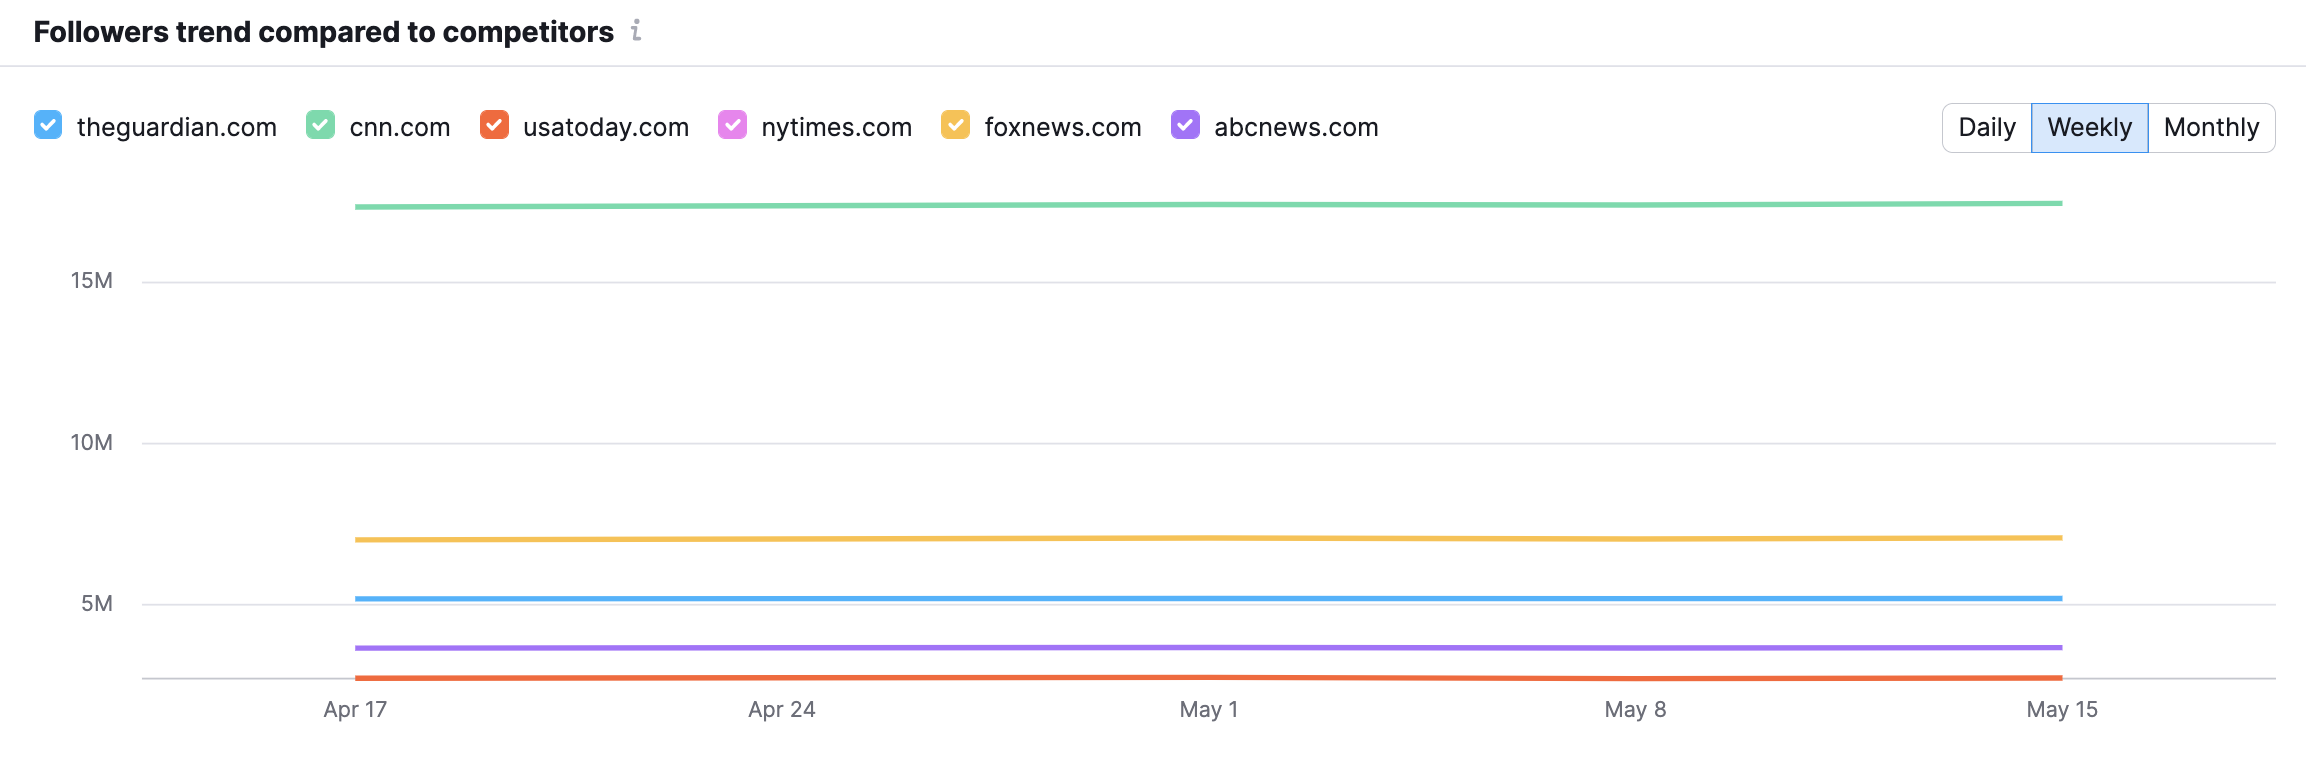
Followers trend compared to competitors
The next graph lets you compare the trends of audience growth between all of your competitors (if they are an Instagram business account). You can select or deselect companies with their colored icons below the graph to narrow the focus.
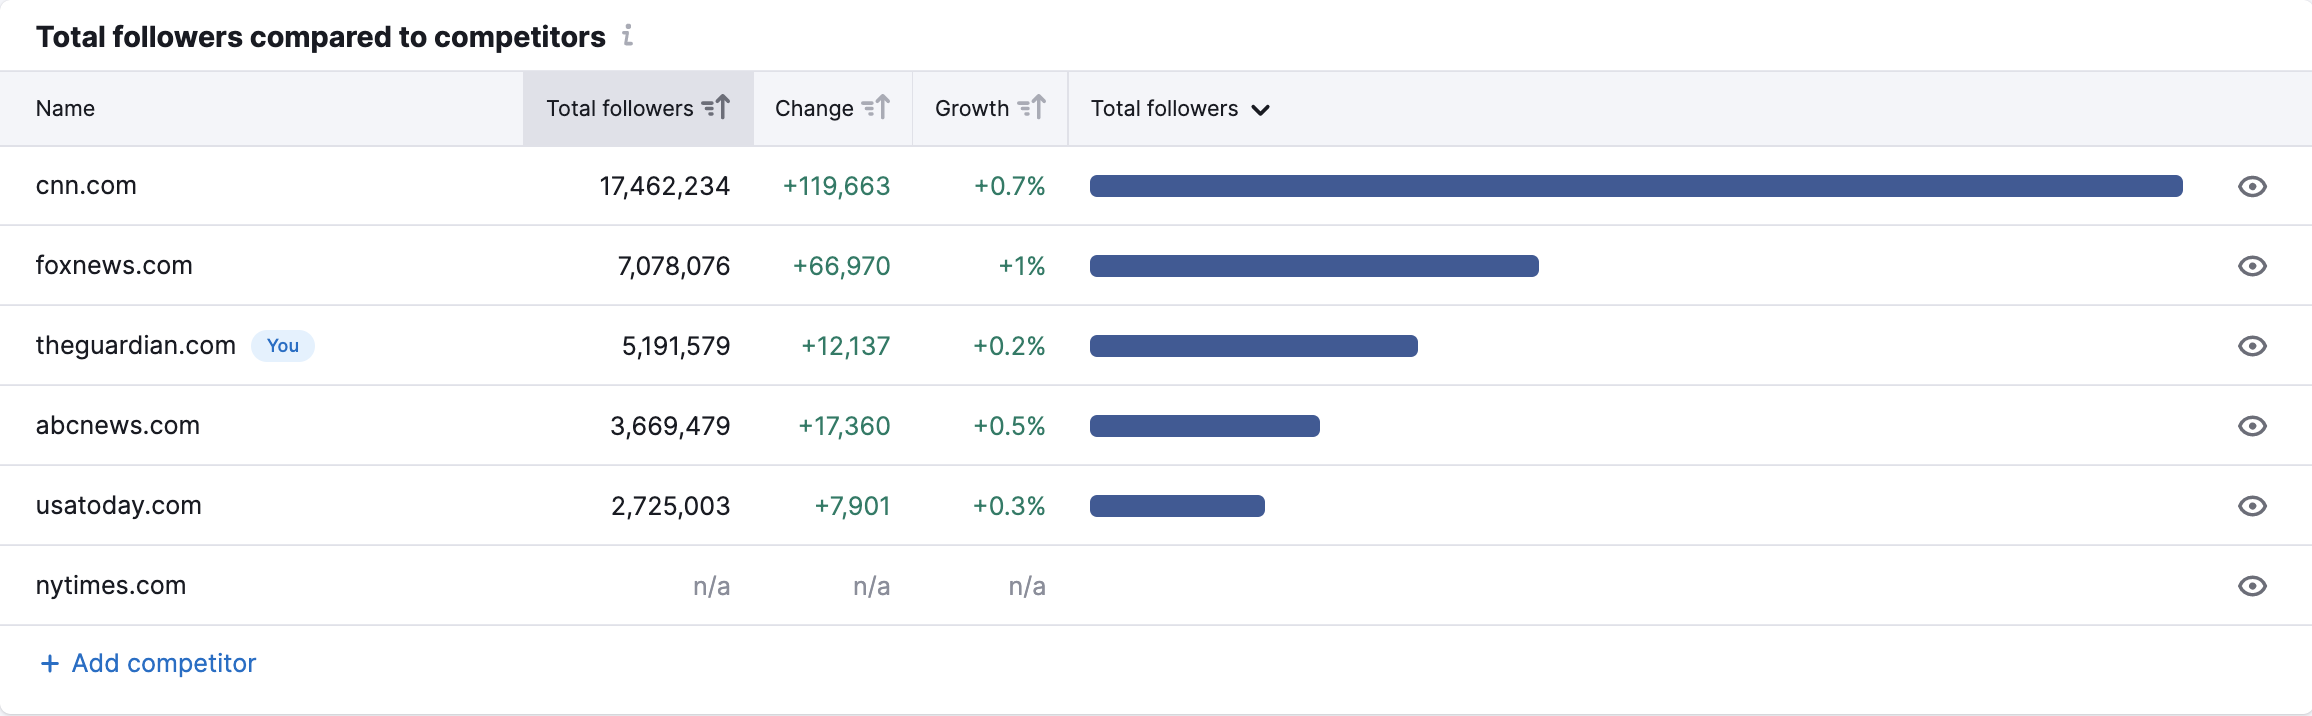
Total followers compared to competitors
The graph at the bottom compares the total audience size, change, and growth % of the competitors in your campaign. Sorting by the change will tell you which profile got the newest followers, and sorting by growth % will tell you which profile had the most audience growth relative to the previous period of time.
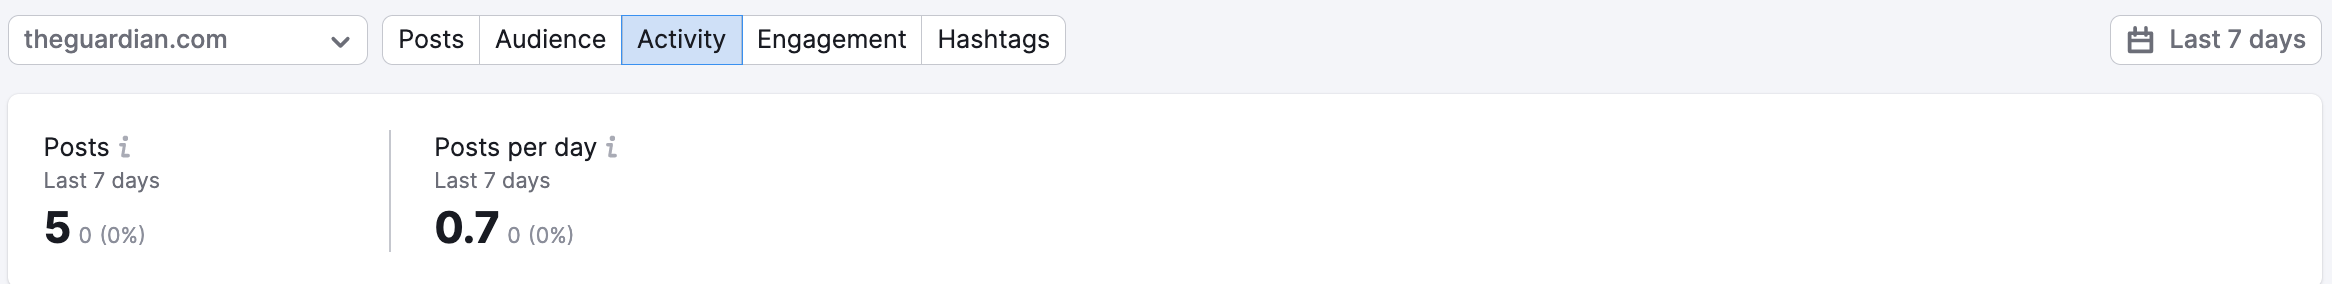
Activity
The top of the Activity report shows how frequently a page has posted on Instagram over your set date range. By default, the current time frame’s activity will be compared to the previous time frame.
If you are viewing the past week, it will be compared to the seven days before that. You can see your competitor’s average number of posts per day, as well as change and growth.
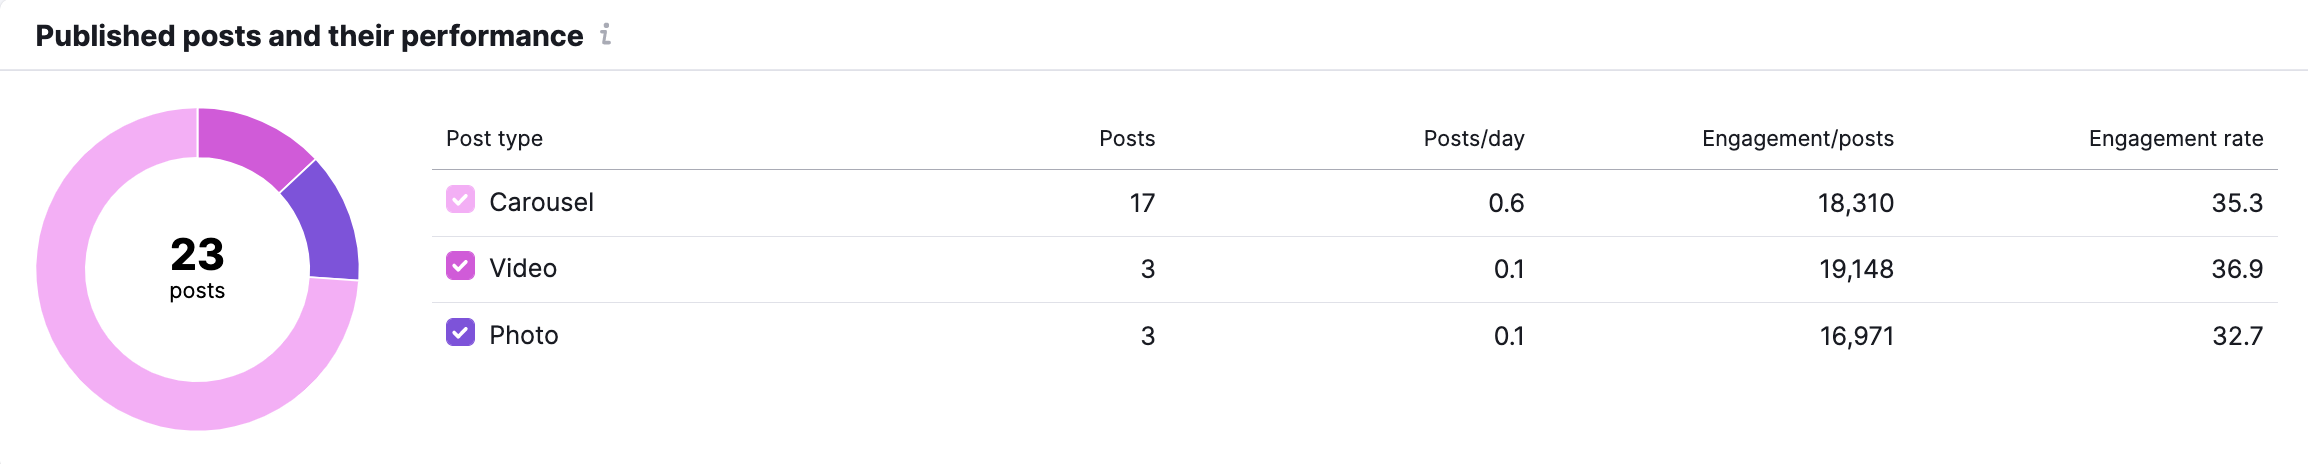
Published Posts and Their Performance
Next, you’ll see a section titled “Published Posts and Their Performance.” This shows you the spread of photos and videos posted by an account. You’ll be able to see how many of each your competitor posts per day and how much engagement the different types of posts generate.
Publishing Trend
The Publishing Trend shows the trend of your competitor’s posting habits over time. You can set the graph to show daily, weekly, or monthly totals.
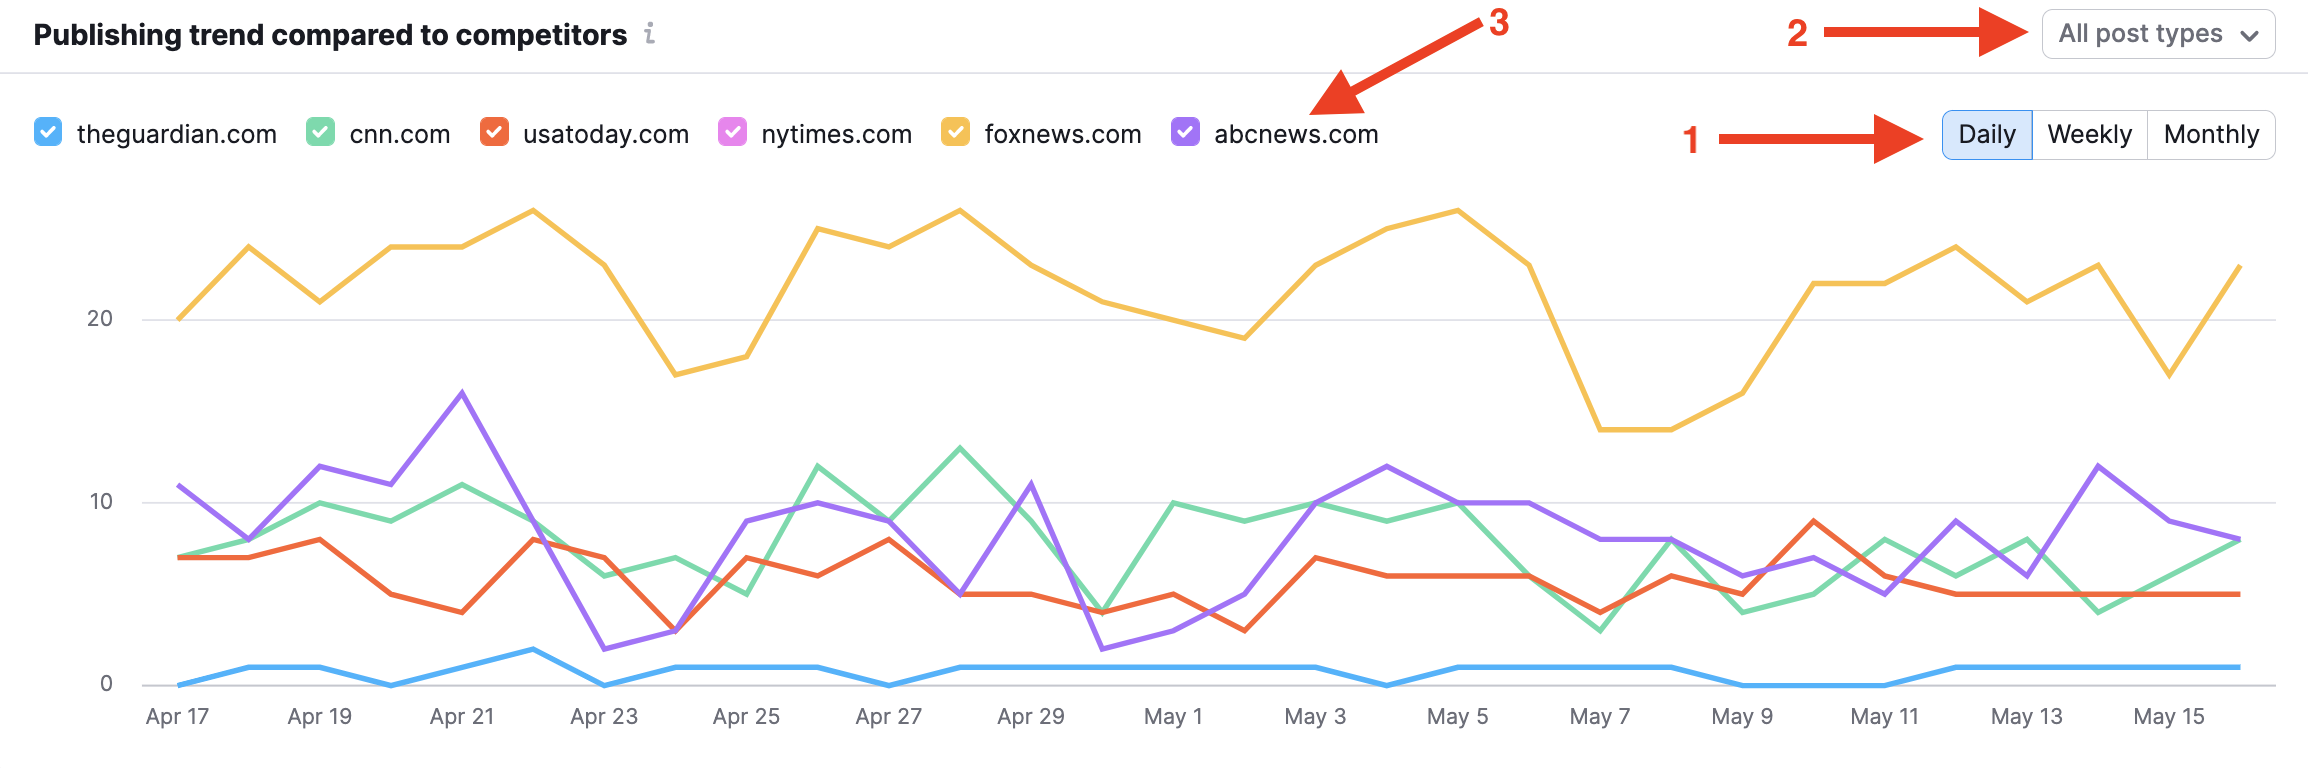
Publishing trend compared to competitors
Below the single competitor’s publishing trend is a graph comparing the publishing trends of all profiles in your campaign. This shows you which competitor is posting the most on a regular basis and if there are any trends in publishing habits that multiple competitors share. You have the ability to plot daily, weekly, or monthly data points (1) and choose to see all post types, only videos or only photos (2). You can also remove any of the competitors with the colored squares below the graph (3).
Number of posts compared to competitors
At the bottom of the Activity report, you can see the number of posts between all of your competitors. This will tell you who in your market or niche is posting the most on Instagram.
You can sort your competitors in order of number of posts, posts per day, or engagement per post.
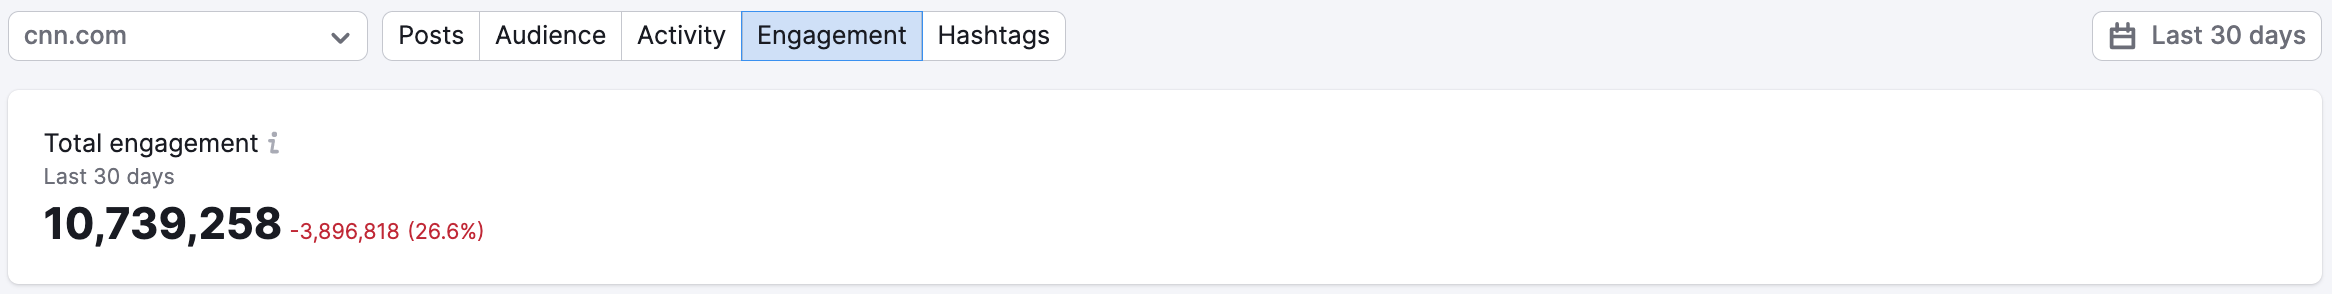
Engagement
The Engagement subsection in the Instagram report shows data on the amount of engagement that a competitor is getting from their Instagram audience. We measure Total Engagement on Instagram as the sum of all likes and comments on a post. The top of the report compares the company’s Total Engagement from your set date range.
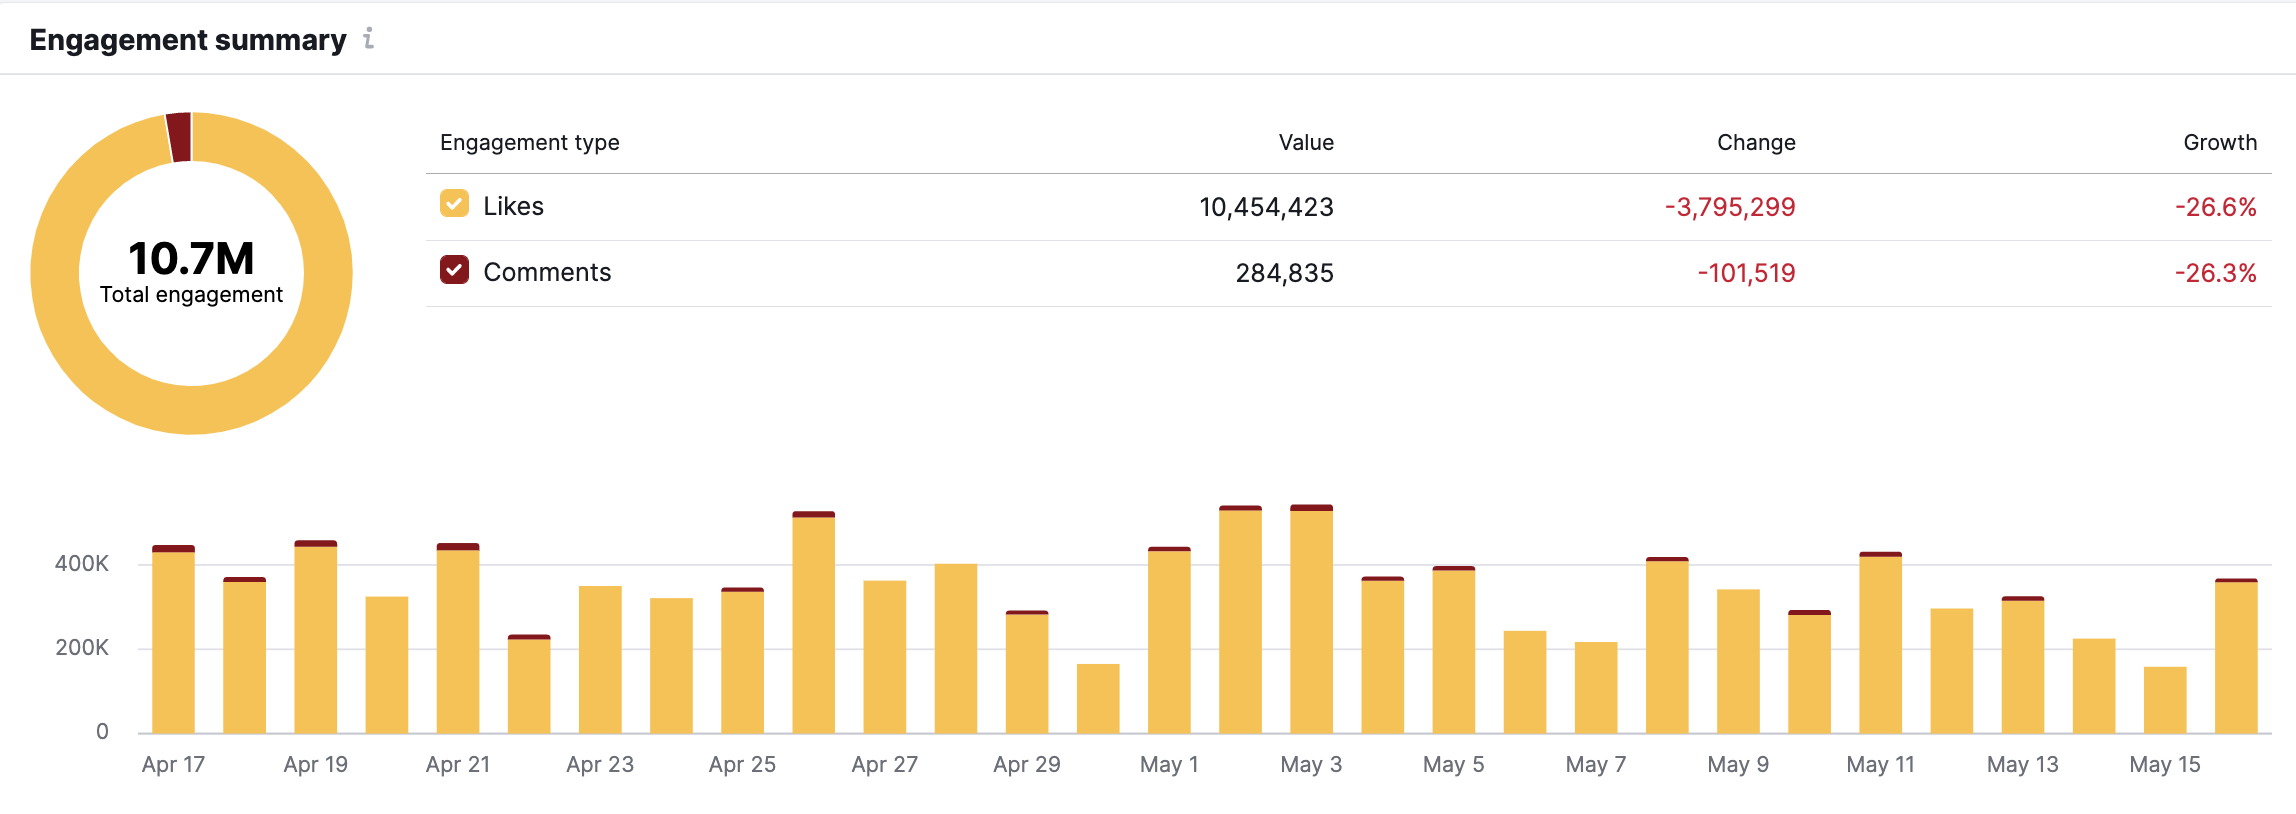
Engagement Summary
The next section details the profile’s engagement by likes and comments. How many more comments and likes is the profile receiving this week compared to last week? You can learn that in the Change and Growth columns. There will also be a little trend graph representing the direction of both types of engagement over the given time period.
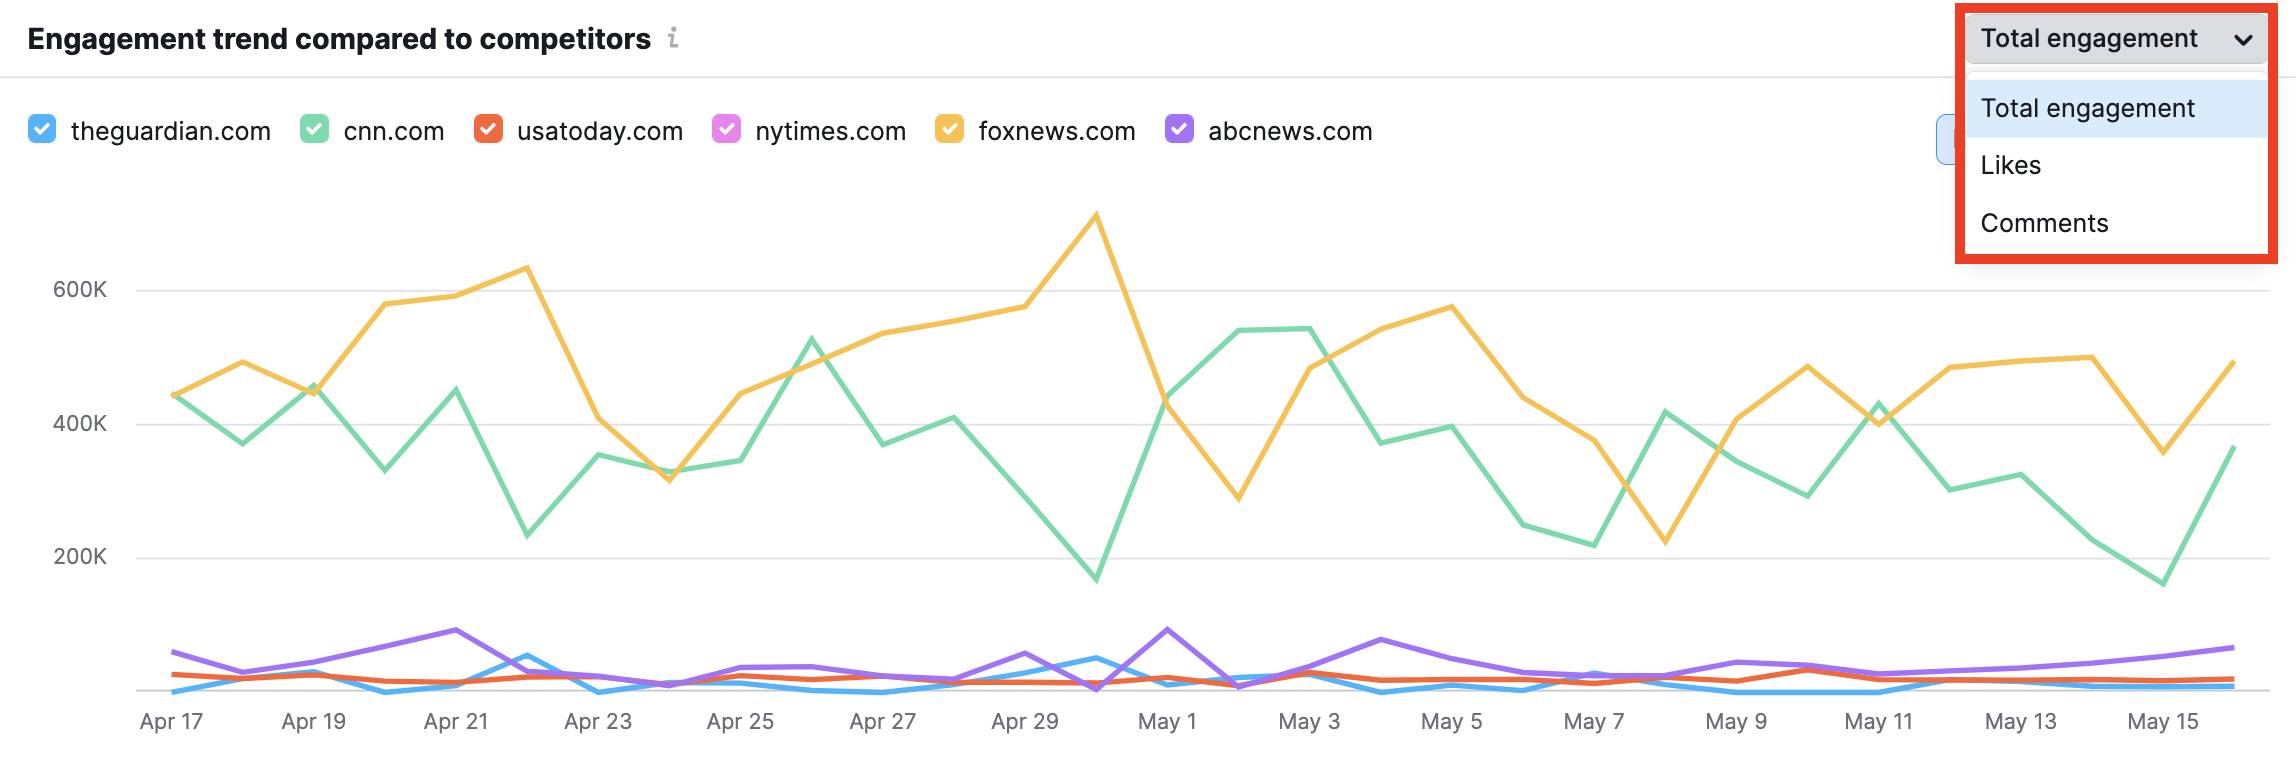
Engagement trend compare to competitors
This next graph allows you to compare the engagement levels between all of the competitors in your campaign. In the bottom right, you can set the graph to measure Total engagement, likes, or comments. This makes it easy to see any significant dates where a competitor posted their most engaging Instagram post.
Total engagement compared to competitors
This bottom graph compares the total engagement of all competitors in your campaign. Sort by change to see which competitor had the biggest numerical increase in engagement, or by growth % to see which competitor’s increase in change showed the most growth relative to the previous time frame.
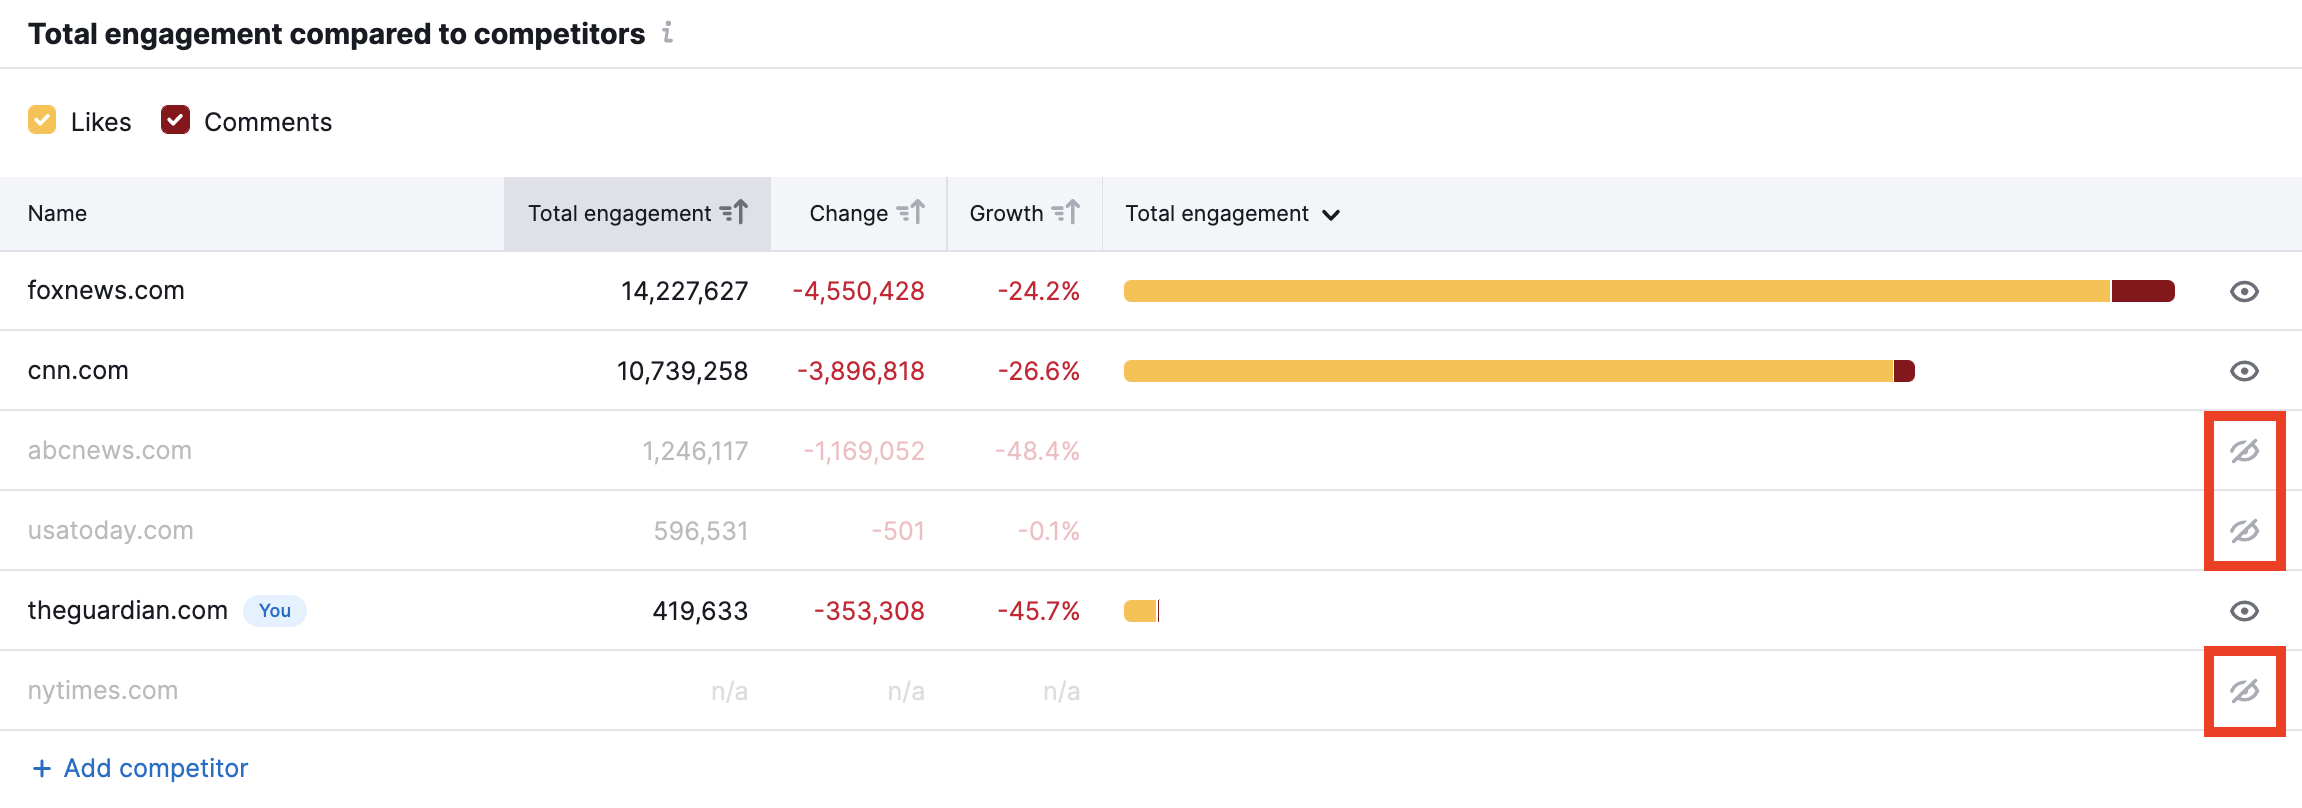
To hide competitors from this graph, use the eye icons to the left of their name.
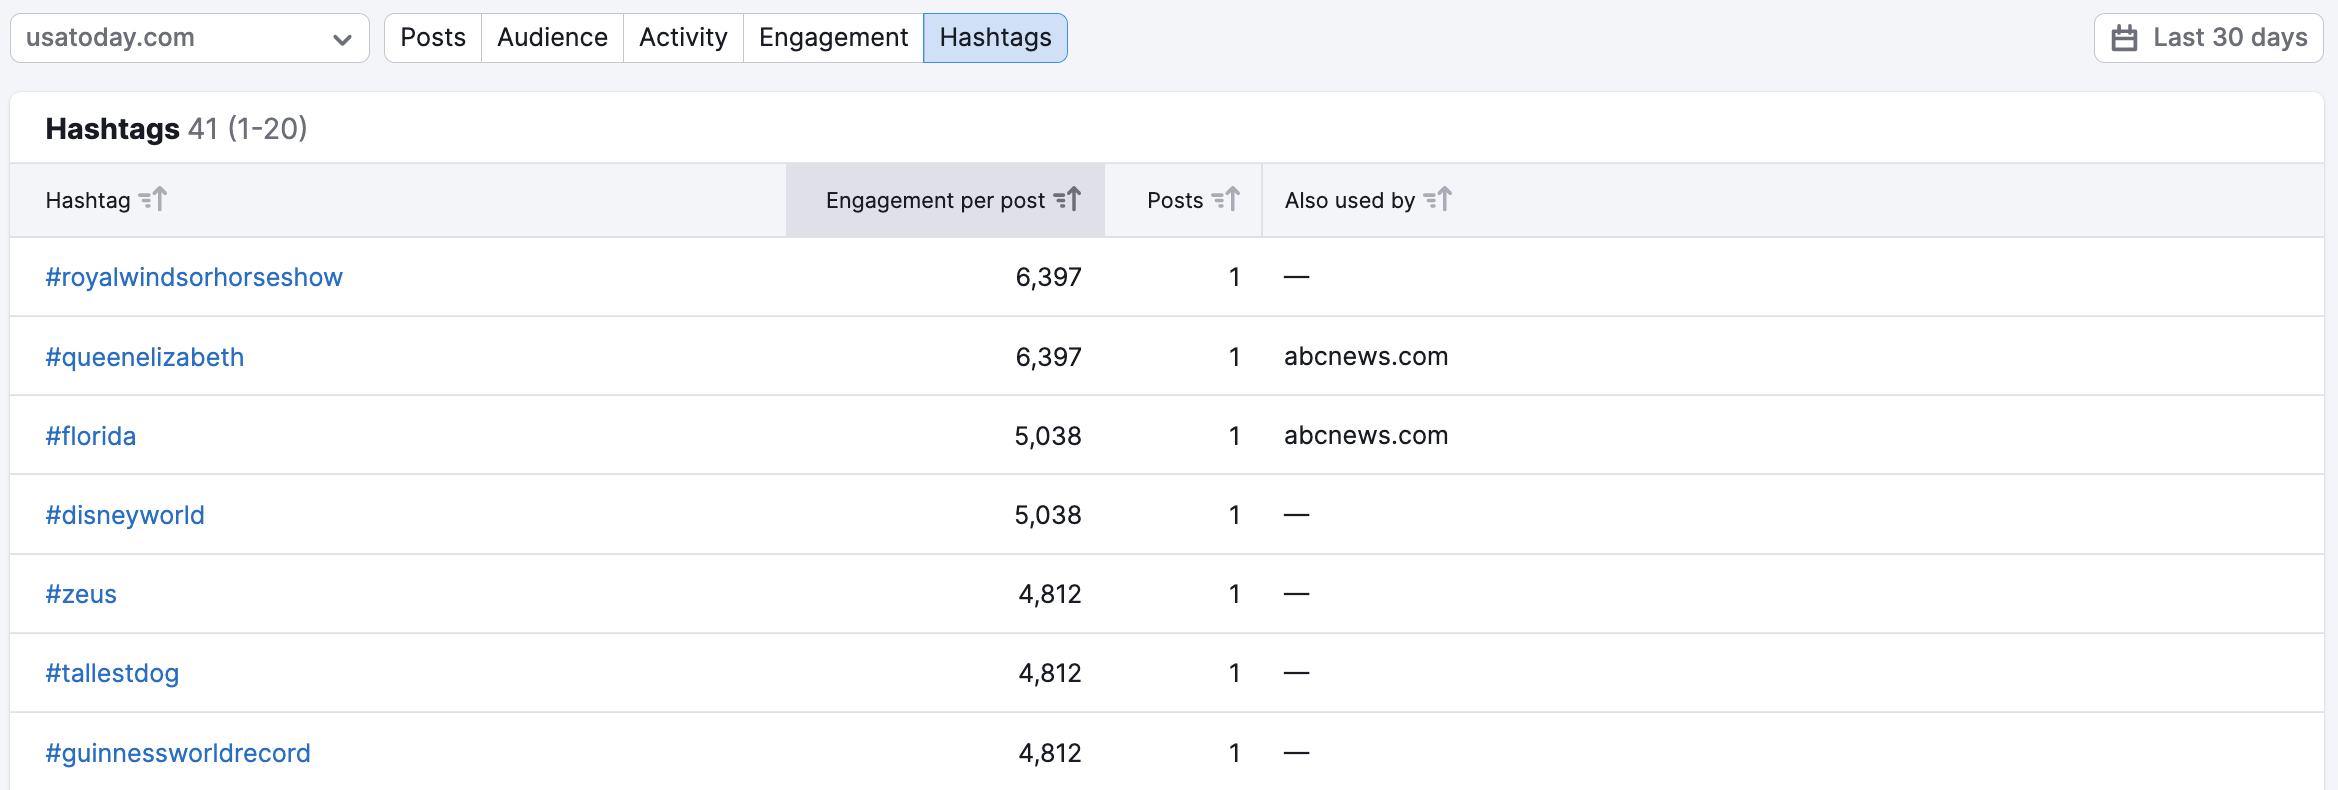
Hashtags
The last subsection of the Instagram report lets you see all of the hashtags used by your competitors. You can view hashtags used by a single competitor or “All profiles” with the company selector (as long as they are Instagram business accounts).
The table tells you which companies in your campaign used each hashtag and sorts them in order of the most engagement per post. Naturally, the hashtags that got the most likes and comments will be at the top of the table. The last column tells you how many total posts by your competitors used the hashtag over the set date range.